AHGW:Create Geophysical Plot Wizard: Difference between revisions
From XMS Wiki
Jump to navigationJump to search
| Line 36: | Line 36: | ||
Plot Properties | Plot Properties | ||
* Plot width | |||
* Plot offset | |||
* Background vertical buffer | |||
* Plot position | |||
Scale Properties | Scale Properties | ||
* Scale label | |||
* Scale vertical offset | |||
* Maximum scale value | |||
* Minimum scale value | |||
* Number of major ticks | |||
* Number of minor ticks between major ticks | |||
* Scale location | |||
Sample Plot and Scale | Sample Plot and Scale | ||
{{-}} | {{-}} | ||
==Step 3: Output Feature Classes== | ==Step 3: Output Feature Classes== | ||
[[File:AHGW-CreateGeophysicalPlotWizard3.png|thumb|450 px|Step 3 of the ''Create Geophysical Plot Wizard'']] | [[File:AHGW-CreateGeophysicalPlotWizard3.png|thumb|450 px|Step 3 of the ''Create Geophysical Plot Wizard'']] | ||
Revision as of 22:01, 7 October 2019
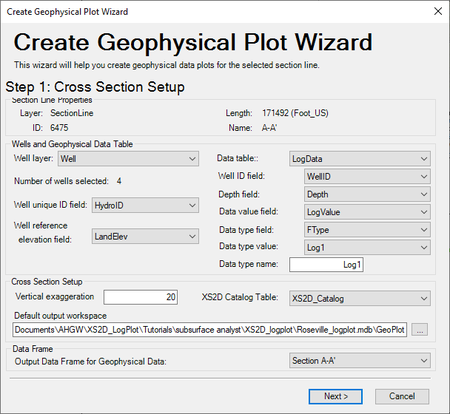
The Create Geophysical Plot Wizard can be used to add geophysical data onto an existing cross section. The wizard is accessed by selecting the Create Geophysical Plot Wizard macro in the Archydro Groundwater toolbar and select a section line. The wizard contains three steps; Cross Section Setup, Scale, and Output Feature Classes.
Step 1: Cross Section Setup
This step defines the cross section setup:
Section Line Properties
- Layer
- ID
- Length
- Name
Wells and Geophysical Data Table
- Well Layer
- Number of wells selected
- Well reference elevation field
- Data table
- Well ID field
- Depth field
- Depth value field
- Data type value
- Data type name
Cross Section Setup
- Vertical exaggeration
- XS2D Catelog Table
- Default output workspace
Data Frame
- Output Data Frame for Geophysical Data
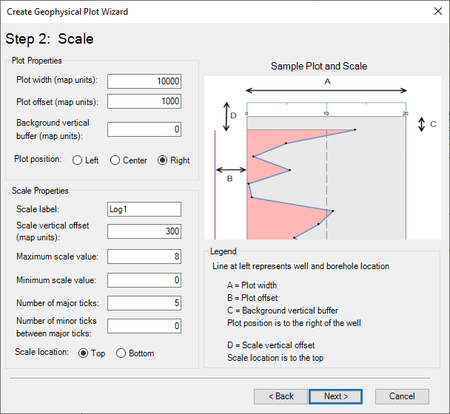
Step 2: Scale
This step defines the plot and scale properties.
Plot Properties
- Plot width
- Plot offset
- Background vertical buffer
- Plot position
Scale Properties
- Scale label
- Scale vertical offset
- Maximum scale value
- Minimum scale value
- Number of major ticks
- Number of minor ticks between major ticks
- Scale location
Sample Plot and Scale
Step 3: Output Feature Classes
This step defines the output feature classes.
Log Feature Classes
Scale Feature Classes
Miscellaneous Options


