SMS:Contour Options
At a glance
- Visualize scalar datasets
- Linear, color filled or both at the same time
- Variable level of transparency
- Full control of ranges and colors
- Precision control for labels and legends
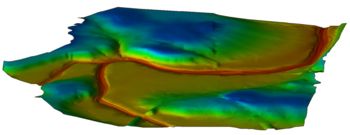
SMS can generate contours from a scalar data set. Contour display is enabled using in the Display Options dialog. Unique contour display options can be set for each module that uses scalar data sets. Contour options can also be set for an individual data set.
The module contour options can be edited by:
- The menu command Data | Contour Options. The data menu is available in most modules. See Module Specific Menus for more information.
- Opening the Display Options dialog
- The Contour Options Macro File:Contour Options.bmp
The data set specific contour options for an individual data set can be edited by:
- Right click on the data set in the Project Explorer and choose "Dataset Contour Options". This will open a dialog where you can define data set specific contour options. If you want to go back to using the module contour options, right click on the data set in the Project Explorer and choose "Clear Dataset Contour Options."
Data Range
The name, minimum value, and maximum value for the active timestep of the data set are shown. These values are sometimes useful when choosing an appropriate contour interval. A minimum and maximum contour value can be specified, restricting the contours interval which will be shown. If the range is not specified, SMS will automatically choose a range based on the minimum and maximum value for the active timestep.
Contour Interval
The contour interval is user controlled. Options include:
- Number of Contours - Specify the number of contours to use. SMS will automatically determine the value for each interval based on the specified range or data set range.
- Specified Interval - Specify the interval to use for contours. SMS will automatically determine the number of contours needed based on the specified range or data set range.
- Specified Values - Specify the number of contours to use and interval.
The items in the upper right section of the Contour Options dialog control the display of a contour legend and the option to accentuate some of the contours. If the Show color legend option is selected, and the contours are not being displayed as a single color, a legend of colors and corresponding data set values is displayed in a corner of Graphics Window. For color filled contours, this legend is a vertical strip of colors with text labels for the contour levels. If the contours are being displayed as linear segments or cubic splines, the legend is displayed as a series of contour level values and a line drawn in the color corresponding to that level. The size, location, label and font for the legend are set using the Legend Options dialog. If the user enters the title "DS" for the legend title, the name of the current data set is used. If the user enters "DS:TS" the current data set and time step are used as the title.
The options in the middle of the right side of the dialog control how the contours are computed and displayed. Three contouring methods are available:
- The default method is Normal Linear Contours and causes the contours to be displayed as piece-wise linear strings.
- If using the Color fill between contours method, the same linear contour strings are computed, but the regions between adjacent contour lines is filled with a solid color.
- If using the Cubic Spline Contours method, the contours are computed in strings and drawn as cubic splines. Drawing the contours as splines can cause the contours to appear smoother. Occasionally, loops appear in the splines or the splines cross neighboring contour splines. These problems can sometimes be fixed by adding tension to the splines. A tension factor greater than zero causes the cubic spline to be blended with or converge to a linear spline based on the same set of points. A tension factor of unity causes the cubic spline to coincide with the linear spline.
In the lower right corner of the Contour Options dialog, two buttons allow the user to specify the contour colors and the contour labeling options.
Related Topics
Modules: Mesh Module · Cartesian Grid Module · Scatter Module · Map Module · GIS Module · Particle Module
Models: ADCIRC · BOUSS-2D · CGWAVE · CMS-Flow · CMS-Wave · FESWMS · FVCOM · Generic Mesh Model · GENESIS · HYDRO AS-2D · PTM · SRH-2D · Steering · STWAVE · TABS · TUFLOW
