User:Jmonson/savedGSDA
Triangulated Irregular Network (TIN) Data
TIN Overview
TIN Definition
A TIN (Triangulated Irregular Network) is a vector data structure which depicts geographic surfaces as contiguous non-overlapping triangles. The vertices of each triangle match the elevation of the terrain exactly. This means that a topographic surface is represented by several triangles, with each triangle face having an approximate slope, aspect, and surface area. The irregularity of the triangles comes from the scattered nature of the (x,y,z) points (the triangle vertices) used as a background elevation source -- hence the name irregular. Once a TIN is created, the elevation of any point on the triangle's continuous surface can be interpolated. WMS can easily create a TIN from any one of the following:
- x,y,z, survey data
- digitizing a topographic map
- a DEM used as a background elevation source.

TINs are made up of non-overlapping triangles.
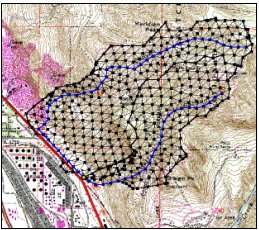
WMS can create a TIN within the watershed boundaries from known elevation points.
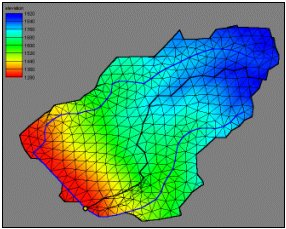
Elevations are then interpolated along the face of each triangle, allowing contours to be drawn.
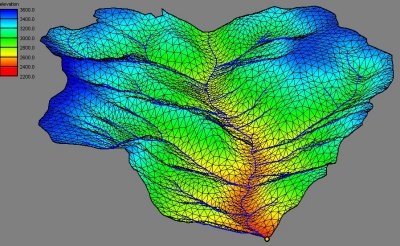
An oblique view of a TIN showing a watershed in Yellowstone National Park.


WMS and TIN Data
It is critical to realize that a TIN created from (x,y,z) data points is generally not yet suited for a hydrologic model. Further preparation and refining of the TIN is required to ensure that linear features such as streams and ridge lines are shown properly on the final TIN to be used for modeling. For example, the edge of a triangle should not cross a stream, but rather conform to it.
Advantages of a TIN
There are several key advantages of a TIN surface model over a grid model like a DEM, and TINs are regarded as a more intelligent data structure. A few of these advantages are:
- Linear geographic features such as streams and ridges are more accurately represented in a TIN.
- Less points are needed to represent the topography—less hard disk space is needed.
- Points can be concentrated in important areas where the topography is more variable, or where more detail is required (e.g., small areas of land). The picture below shows the TIN vertices spaced much closer together near the watershed outlet.

- Survey data and known elevations can easily be incorporated into a TIN.
- Some functions cannot be performed with DEM data, but are easily done with a TIN. Examples of this include creating storage-capacity curves for reservoirs, floodplain delineation, and computing time-area curves for hydrographs.