File:Damping Reflection Relationship-Fig 5- BOUSS-2D Technical Report.png
From XMS Wiki
Jump to navigationJump to search
No higher resolution available.
Damping_Reflection_Relationship-Fig_5-_BOUSS-2D_Technical_Report.png (637 × 557 pixels, file size: 29 KB, MIME type: image/png)
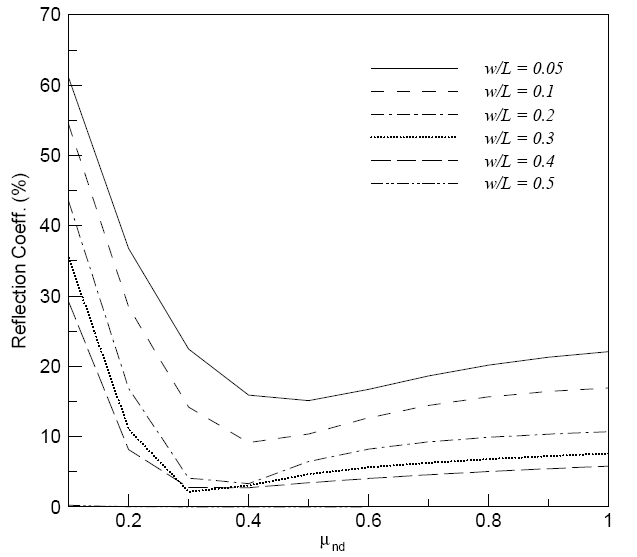
This graph from BOUSS-2D's technical report illustrates the variation of effective reflectivity given various damping coefficients and damping layer widths. To use this graph:
- Compute L (the wavelength for the incident wave).
- Select a w/L ratio. Use this ratio to compute w (damping width).
- Select an expected reflection percentage. Follow a horizontal line for this percentage on plot to intersect the graph for selected w/L ratio. Read associated damping coefficient from plot.
- Note that the reflection coefficient is very sensitive to a change in damping coefficient when the coefficient is small (< 0.3) and much less sensitive when the coefficient is larger.
- This process may require the damping parameters be changed when different wave conditions are considered.
- It should be observed that this plot is for normally incident waves. Different reflection coefficients would be obtained for obliquely incident waves.
File history
Click on a date/time to view the file as it appeared at that time.
| Date/Time | Thumbnail | Dimensions | User | Comment | |
|---|---|---|---|---|---|
| current | ★ Approved revision 15:48, 26 September 2007 | | 637 × 557 (29 KB) | Azundel (talk | contribs) |
You cannot overwrite this file.
File usage
The following page uses this file: