User:Rcorrigan/Functional Surface Options
From XMS Wiki
Jump to navigationJump to search
Quadtree UGrid Functional Surface Options.

To create/display functional surfaces, enable them in the display options of the appropriate module, and specify their attributes which include:
- Dataset – Selects which dataset is to be used to form the functional surface.
- Use active dataset
- User defined dataset
- Z Offset – SMS displays functional surfaces at a simulated z-value. This may be the actual surface value (such as is the case with water surfaces elevations), but more often the value will not have a physical meaning, and may intersect the bathymetry or not even be in the same area. For this reason, SMS offers options for placing the functional surface at one of the following locations:
- "Display surface at location"
- "Display surface above geometry"
- "Display surface with user defined offset"
- Z Magnification – Functional data may not vary significantly when compared to the horizontal extents of the model. For this reason, the interface allows magnification (scaling) of the functional surface. By default, the surface is scaled based on the global z-magnification specified in the general display options. This may be overridden.
- Override global value
- Magnification value
- Display Attributes – Controls the color of the functional surface. It may be a constant color or colored based on the contour colors specified. The colors may be associated with the value of the functional surface, or another dataset. The surface may also be partially transparent.
- Use solid color – This color can be turned on and off. It will get hidden if face contour options are engaged in the Functional Surface Other Options dialog.
- Transparency – Adjusts the transparency of the functional surface.
- Use active dataset for contours – Uses the active dataset to define the contours that get displayed.
- Specify Separate dataset for contours – Option to specify dataset other than the active dataset as the dataset for the contours.
- Select... – Opens a Select Scalar Dataset dialog for selecting the dataset for the contours.
- Other Display Options... – This opens the Functional Surface Other Options dialog.
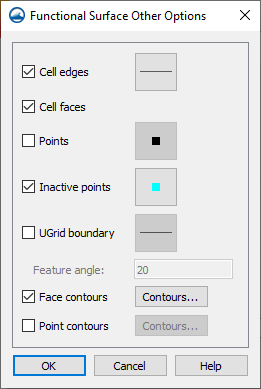
Functional Surface Other Options dialog. - "Cell edges" – Controls whether the cells of the UGrid will be displayed on the functional surface. Selecting the line icon next to it opens the Line Properties dialog which allows for defining the style, width, and color of the cell edge lines.
- "Cell faces"
- "Points" – Controls whether the points of intersection of the UGrid lines will be displayed. Selecting the symbol icon next to it opens the Symbol Attributes dialog which allows for adjusting the size and color of the points represented on this surface.
- "Inactive points" – Controls whether point with an inactive dataset value are displayed. Selecting the symbol icon next to it opens the Symbol Attributes dialog which allows for adjusting the size and color of the inactive points represented on this surface.
- "UGrid boundary" – Controls whether the UGrid boundary will be displayed. Selecting the line icon next to it opens the Line Properties dialog dialog which allows for defining the style, width, and color of the cell edge lines.
- "Feature angle" – The UGrid boundary feature angle is used only when the UGrid Boundary option is selected.
- "Face contours" – Controls the display of cell face contours. When an object is contoured, the values associated with the active dataset for the object are used to generate the contours. Selecting Contours... will bring up a Contour Options dialog for adjusting face contour display.
- "Point contours" – Controls the display of points and their corresponding contour data. Instead of displaying a continuous contoured graphic, it will represent the data with contoured colors at the the points of the grid line intersections. These points will be displayed over the points being displayed by the "Points" option from earlier. However, if a larger point size is desired, those options can be adjusted by selecting the point icon next to the "Points" option. Selecting Contours... will bring up a Contour Options dialog for adjusting point contour display.
