Search results
From XMS Wiki
Jump to navigationJump to search
Page title matches
- ...mages for examples of data displayed in plan and oblique view with display order turned off and on. ...layOrderOffPlanView.png|A plan view of a delineated watershed with display order turned '''off'''. Notice several contours and other objects "bleed" throug2 KB (275 words) - 15:24, 28 September 2017
Page text matches
File:DisplayOrderOnObliqueView.png [[Category:WMS Display Options]] ...contours look cluttered because entire objects are displayed using display order instead of closer entities being displayed in front of entities that are fu(866 × 597 (521 KB)) - 14:44, 20 August 2014- ...mages for examples of data displayed in plan and oblique view with display order turned off and on. ...layOrderOffPlanView.png|A plan view of a delineated watershed with display order turned '''off'''. Notice several contours and other objects "bleed" throug2 KB (275 words) - 15:24, 28 September 2017
File:DisplayOrderOffPlanView.png [[Category:WMS Display Options]] A plan view of a delineated watershed with display order turned off. Notice several contours and other objects "bleed" through the p(800 × 548 (403 KB)) - 15:03, 4 May 2016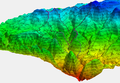
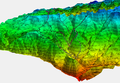
File:DisplayOrderOffObliqueView.png [[Category:WMS Display Options]] An oblique view of a delineated watershed with display order turned off. Notice the cleaner look of the watershed map.(866 × 597 (512 KB)) - 14:44, 20 August 2014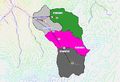
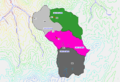
File:DisplayOrderOnPlanView.png [[Category:WMS Display Options]] A plan view of a delineated watershed with display order turned on. Notice the cleaner look of the watershed map.(872 × 599 (67 KB)) - 14:44, 20 August 2014- ...tant whenever a rectangle or oval is displayed in the color fill mode. The order of drawing objects can be controlled using the '''Move to Front''', '''Move [[WMS:Display Options|Drawing Object Display Options]]1 KB (207 words) - 15:22, 12 June 2007
- ...S must have the correct units defined for the raw data (DEM, TIN, etc.) in order to make the appropriate conversions to model units such as square miles, ki ...or:red">WMS requires that the Horizontal and Vertical units be the same in order to correctly estimate slopes.</span>2 KB (290 words) - 16:34, 26 April 2018
- The first step in using a new digital image for either background display or for texture mapping is to import the image. This can be done by either s ==Image Display Options==5 KB (839 words) - 19:58, 6 March 2023
- ...and the ''TIN-Drainage'' tab. Also the ''Drainage Data'' tab controls the display of text with computed geometric parameters for watersheds done with either [[Image:WMSdisplayopts.jpg|thumb|500 px|Display Options dialog]]4 KB (681 words) - 15:35, 28 September 2017
- ...ining the well for which you wish to build the lithography or stratigraphy display. ...table, which stores the information about the feature classes used for the display of this well.2 KB (305 words) - 23:41, 9 September 2019
- :[[WMS:Display Menu|Display Menu]] ;3.3. The Display Options3 KB (358 words) - 01:10, 29 January 2020
- ...order of priority for the rasters that will be used for interpolation. The order determines which raster the program will look at first to interpolate data :# Adjust the [[SMS:Display Options|'''Display Options''']] [[File:Display Options Macro.svg|16px]].3 KB (444 words) - 20:26, 28 February 2022
- ...nt types, although it may be used in transient simulations. This plot can display the mean error, mean absolute error, and root mean squared error between su ...the order, highlight a solution and move it up or down to rearrange their order.3 KB (504 words) - 18:12, 14 April 2022
- In order to compute the pathlines, the FEMWATER solution must contain nodal velocity ===Display Options===3 KB (419 words) - 14:10, 11 June 2019
- ...Display.png|350px|thumb|right|''Create Lithostratigraphy Hydrostratigraphy Display'' dialog]] ...nit, along with polygon features for displaying text information about the display. This tool is typically used alongside the [[AHGW:Create XS2D Geophysical P7 KB (1,031 words) - 17:54, 14 November 2019
- ...on.svg|16 px]] or deleted [[File:Delete Row Icon.svg|16 px]] to change the order. ...material set the active set. It is possible [[GMS:3D_Grid_Display_Options|display a legend]] showing the named layer ranges.2 KB (315 words) - 15:03, 2 June 2017
- ...x|reflist}}, {{tag|references|s}} or similar as there is no control of the order in which references are displayed. ...nine author names to display, "et al." may be suppressed by setting {{para|display-authors|9}}. Aliases: '''displayauthors'''.}}5 KB (787 words) - 15:49, 28 May 2014
- ...are specified in the [[GMS:Feature Object Display Options|''Feature Object Display Options'']] dialog. ...nearly interpolate the observed value at the model output time in order to display an observation target. If the model output time is before the first observe2 KB (357 words) - 14:36, 26 October 2017
- ...ol Cards'' toggle box, and then selecting a job control card from the text display window. ...ext hydrograph station buttons to cycle through hydrograph stations in the order they are computed by HEC-1. Since the dialog is part of the main screen, al2 KB (326 words) - 22:11, 13 July 2020
- ...Display Options Macro.svg|16 px]] macro. The following table describes the display options available for the TIN module. ! width="125" | Display Option !! Description4 KB (699 words) - 18:14, 5 April 2022


