SMS:Wave Gages: Difference between revisions
| Line 24: | Line 24: | ||
Clicking on the '''Data ...''' button for any of the gages brings up the ''Wave Events'' dialog. This dialog displays the time, height, period and direction (in shore normal coordinates) for the gage. The data is in a spread sheet, so it may be copied and pasted from other spread sheet data. There is also an '''Import''' button that can be used bring up the [[SMS:File Import Wizard|''Import Wizard'']] to bring in wave events data stored in a text file. The data is saved and passed to the model in the wave file. | Clicking on the '''Data ...''' button for any of the gages brings up the ''Wave Events'' dialog. This dialog displays the time, height, period and direction (in shore normal coordinates) for the gage. The data is in a spread sheet, so it may be copied and pasted from other spread sheet data. There is also an '''Import''' button that can be used bring up the [[SMS:File Import Wizard|''Import Wizard'']] to bring in wave events data stored in a text file. The data is saved and passed to the model in the wave file. | ||
==Modify 1D Wave Line== | ==Modify 1D Wave Line== | ||
Used with CGWAVE, the paramters must first be defined in the ''CGWAVE Model Control'' dialog. | |||
[[File:CGWAVE Modift1DWave.png|thumb|none|450 px|The ''Modify 1D Wave Line'' dialog]] | [[File:CGWAVE Modift1DWave.png|thumb|none|450 px|The ''Modify 1D Wave Line'' dialog]] | ||
Revision as of 15:19, 3 July 2019
Wave gages provide boundary condition information to a GenCade simulation. The wave height, period and direction influence the transport of material on the shoreline and the shoreline morphology. The GenCade model allows defining multiple wave gages, providing for spatially varied driving force.
The wave gage is created either as an Attribute on a feature point in the GenCade coverage, which will be mapped to a specific cell in the grid, or it may be specified directly on the grid. For each wave gage, specify a depth and wave events. Each wave event has a date and time, a H0, a period, and a direction. The model computes the wave conditions for each cell in the grid by interpolating the data from the neighboring wave gages.
Wave gages specified in a GenCade coverage will be displayed at the feature point in the coverage, and will appear when the 1D grid (not grid frame) is created on the associated cell in the grid.
If attributes of a wave gage are changed on a feature point, these changes do not impact the simulation unless the attributes are mapped to the grid again (Map → 1D grid). Wave gages can be edited using the Edit Wave Data.. option from the GenCade menu after the grid is created and still take effect.
Wave Events
Wave events can be edited by clicking on the Data... button when editing the wave gage. This can be done for either a gage on a 1D grid, or a gage at a feature point.
The direction of a wave, for a given wave event, for a given wave gage may be specified in a meteorological, oceanographic, or Cartesian convention. Also, the wave direction can be specified in a shore normal convention as long as a 1D grid or 1D grid frame is present in the coverage which contains the wave gage. The default convention for wave gages is meteorological.
Wave Data for GenCade
Wave conditions, including significant wave height, peak period, and direction, drive the transport forces that impact coastal morphology. GenCade requires wave data for at least one location in the domain, and supports options for specifying wave data at multiple locations in the domain. Each wave gage includes:
- A location – (X,Y) coordinate as a feature point and Cell ID as an input to the model.
- A depth – The water depth at the gage.
- A time series of wave data events – Obtain these events either from a buoy or from a local wave transformation model.
Issuing the command to edit wave data invokes the Wave Gages dialog. This dialog lists the gauge cell IDs and the depths. It also includes a button for each gage to view/edit the wave data at that gage.
Clicking on the Data ... button for any of the gages brings up the Wave Events dialog. This dialog displays the time, height, period and direction (in shore normal coordinates) for the gage. The data is in a spread sheet, so it may be copied and pasted from other spread sheet data. There is also an Import button that can be used bring up the Import Wizard to bring in wave events data stored in a text file. The data is saved and passed to the model in the wave file.
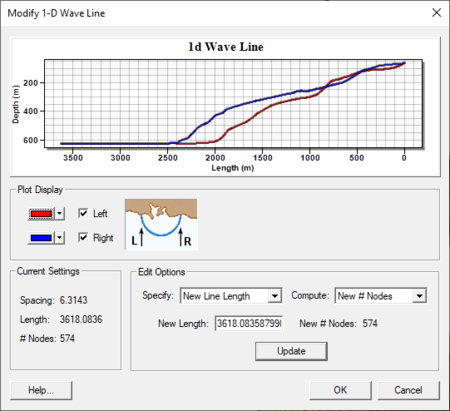
Modify 1D Wave Line
Used with CGWAVE, the paramters must first be defined in the CGWAVE Model Control dialog.
Related Topics
SMS – Surface-water Modeling System | ||
|---|---|---|
| Modules: | 1D Grid • Cartesian Grid • Curvilinear Grid • GIS • Map • Mesh • Particle • Quadtree • Raster • Scatter • UGrid |  |
| General Models: | 3D Structure • FVCOM • Generic • PTM | |
| Coastal Models: | ADCIRC • BOUSS-2D • CGWAVE • CMS-Flow • CMS-Wave • GenCade • STWAVE • WAM | |
| Riverine/Estuarine Models: | AdH • HEC-RAS • HYDRO AS-2D • RMA2 • RMA4 • SRH-2D • TUFLOW • TUFLOW FV | |
| Aquaveo • SMS Tutorials • SMS Workflows | ||
