SMS:CGWAVE Tables and Figures: Difference between revisions
From XMS Wiki
Jump to navigationJump to search
No edit summary |
No edit summary |
||
| (14 intermediate revisions by the same user not shown) | |||
| Line 1: | Line 1: | ||
<gallery> | Below are tables and figures for the CGWAVE model. | ||
<gallery widths="570px" heights="300px"> | |||
Image:CGWave_figure1.jpg | Figure 1: Harbor wave model domain; definition sketch. | Image:CGWave_figure1.jpg | Figure 1: Harbor wave model domain; definition sketch. | ||
Image:CGWAVE_figure2_1.jpg | Image:CGWAVE_figure2_1.jpg|Figure 2a: A values for determining α (from Li et al. 2005); see also Table 1. | ||
Image:CGWAVE_figure2_2.jpg|Figure | Image:CGWAVE_figure2_2.jpg|Figure 2b: B values for determining α (from Li et al. 2005); see also Table 1. | ||
Image:CGWAVE_table1.jpg| Table 1: Numerical Values Corresponding to | Image:CGWAVE_table1.jpg| Table 1: Numerical Values Corresponding to Figures 2a and 2b. | ||
</gallery> | </gallery> | ||
| Line 15: | Line 17: | ||
[[Category:CGWAVE]] | [[Category:CGWAVE]] | ||
[[Category:Gallery]] | |||
Latest revision as of 16:19, 29 September 2017
Below are tables and figures for the CGWAVE model.
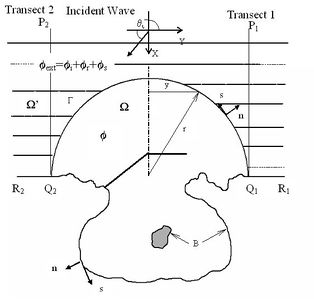
Figure 1: Harbor wave model domain; definition sketch.
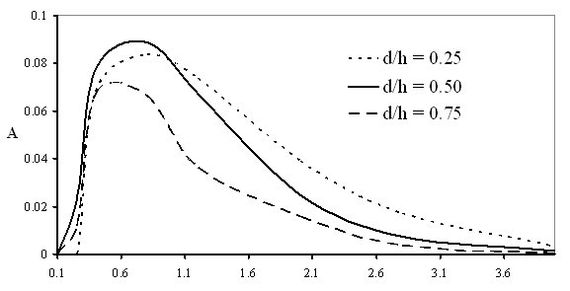
Figure 2a: A values for determining α (from Li et al. 2005); see also Table 1.
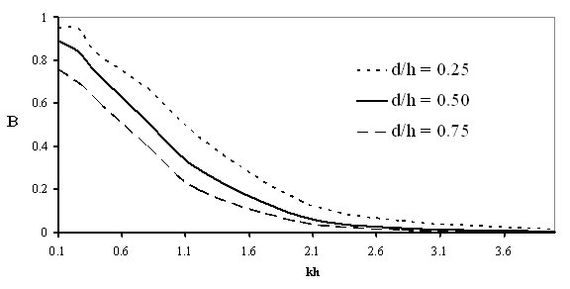
Figure 2b: B values for determining α (from Li et al. 2005); see also Table 1.
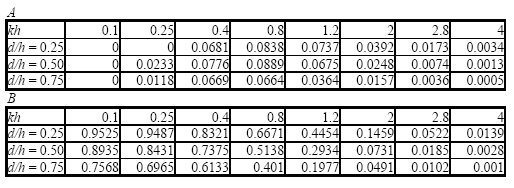
Table 1: Numerical Values Corresponding to Figures 2a and 2b.


SMS – Surface-water Modeling System | ||
|---|---|---|
| Modules: | 1D Grid • Cartesian Grid • Curvilinear Grid • GIS • Map • Mesh • Particle • Quadtree • Raster • Scatter • UGrid |  |
| General Models: | 3D Structure • FVCOM • Generic • PTM | |
| Coastal Models: | ADCIRC • BOUSS-2D • CGWAVE • CMS-Flow • CMS-Wave • GenCade • STWAVE • WAM | |
| Riverine/Estuarine Models: | AdH • HEC-RAS • HYDRO AS-2D • RMA2 • RMA4 • SRH-2D • TUFLOW • TUFLOW FV | |
| Aquaveo • SMS Tutorials • SMS Workflows | ||