SMS:Quadtree Display Options: Difference between revisions
From XMS Wiki
Jump to navigationJump to search
No edit summary |
No edit summary |
||
| Line 5: | Line 5: | ||
*''[[SMS:Contour Options|Contours]]'' – The mesh contours are drawn for the active scalar dataset. Use the contours tab to change [[SMS:Contours|contour]] options. | *''[[SMS:Contour Options|Contours]]'' – The mesh contours are drawn for the active scalar dataset. Use the contours tab to change [[SMS:Contours|contour]] options. | ||
*''Vectors'' – The cartesian grid vectors are drawn for the active vector dataset. All standard vector display options are supported. | *''Vectors'' – The cartesian grid vectors are drawn for the active vector dataset. All standard vector display options are supported. | ||
* ''Grid Boundary'' – A line around the perimeter of the quadtree grid can be drawn. This is useful when the cells are turned off. | * ''Grid Boundary'' – A line around the perimeter of the quadtree grid can be drawn. This is useful when the cells are turned off. Options allow specifying line color and thickness. | ||
*Cell id | *Cell id | ||
*IJ triad | *IJ triad | ||
Revision as of 18:01, 1 February 2016
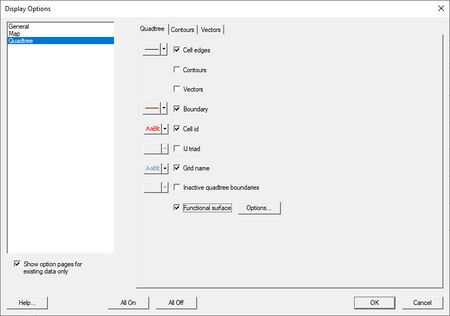
Other entities associated with the Quadtree module with display options are shown below. Some of these entities also show an Options button to the right. For these entities, additional display controls are available. The available grid display options include the following:
- Cell edges
- Contours – The mesh contours are drawn for the active scalar dataset. Use the contours tab to change contour options.
- Vectors – The cartesian grid vectors are drawn for the active vector dataset. All standard vector display options are supported.
- Grid Boundary – A line around the perimeter of the quadtree grid can be drawn. This is useful when the cells are turned off. Options allow specifying line color and thickness.
- Cell id
- IJ triad
- Grid name
- Inactive quadtree boundaries
- Functional Surface – Show surfaces representing one of the functional datasets associated with a mesh, grid or TIN.
Related Topics
SMS – Surface-water Modeling System | ||
|---|---|---|
| Modules: | 1D Grid • Cartesian Grid • Curvilinear Grid • GIS • Map • Mesh • Particle • Quadtree • Raster • Scatter • UGrid |  |
| General Models: | 3D Structure • FVCOM • Generic • PTM | |
| Coastal Models: | ADCIRC • BOUSS-2D • CGWAVE • CMS-Flow • CMS-Wave • GenCade • STWAVE • WAM | |
| Riverine/Estuarine Models: | AdH • HEC-RAS • HYDRO AS-2D • RMA2 • RMA4 • SRH-2D • TUFLOW • TUFLOW FV | |
| Aquaveo • SMS Tutorials • SMS Workflows | ||
