SMS:Quadtree Display Options
From XMS Wiki
Jump to navigationJump to search
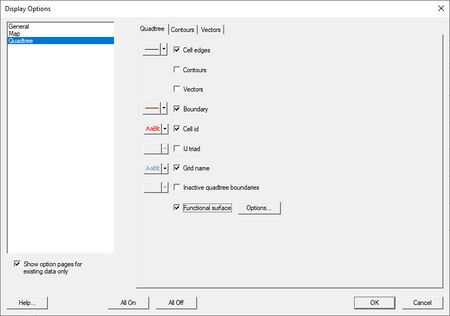
- Cell edges
- Contours – The mesh contours are drawn for the active scalar dataset. Use the contours tab to change contour options.
- Vectors – The cartesian grid vectors are drawn for the active vector dataset. All standard vector display options are supported.
- Grid Boundary – A line around the perimeter of the quadtree grid can be drawn. This is useful when the cells are turned off. User specifies line color and thickness.
- Cell id
- IJ triad
- Grid name
- Inactive quadtree boundaries
- Functional Surface – Show surfaces representing one of the functional datasets associated with a mesh, grid or TIN.
Related Topics
SMS – Surface-water Modeling System | ||
|---|---|---|
| Modules: | 1D Grid • Cartesian Grid • Curvilinear Grid • GIS • Map • Mesh • Particle • Quadtree • Raster • Scatter • UGrid |  |
| General Models: | 3D Structure • FVCOM • Generic • PTM | |
| Coastal Models: | ADCIRC • BOUSS-2D • CGWAVE • CMS-Flow • CMS-Wave • GenCade • STWAVE • WAM | |
| Riverine/Estuarine Models: | AdH • HEC-RAS • HYDRO AS-2D • RMA2 • RMA4 • SRH-2D • TUFLOW • TUFLOW FV | |
| Aquaveo • SMS Tutorials • SMS Workflows | ||
