SMS:Exporting Profile Dialog: Difference between revisions
From XMS Wiki
Jump to navigationJump to search
(→Export) |
|||
| Line 13: | Line 13: | ||
== Export Destination == | == Export Destination == | ||
In this section, select where SMS will send the plot data when exporting. | In this section, select where SMS will send the plot data when exporting. | ||
* ClipBoard – Sends the plot data to the clipboard memory of the computer. | * ''ClipBoard'' – Sends the plot data to the clipboard memory of the computer. | ||
* File – Creates an ASCII text file of the data. Selecting the '''Browse''' button allows specifying the location where the file will be saved. | * ''File'' – Creates an ASCII text file of the data. Selecting the '''Browse''' button allows specifying the location where the file will be saved. | ||
* Printer – Exports the data to an active printer. | * ''Printer'' – Exports the data to an active printer. | ||
== Export Size == | == Export Size == | ||
Revision as of 15:47, 12 September 2017
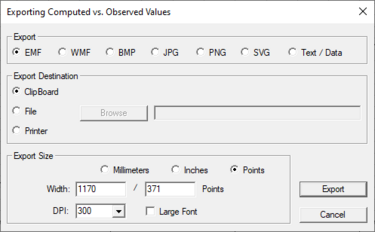
The Exporting Profile dialog allows exporting the plot data. The dialog is reached through the Export/Print command when right-clicking on an active plot.
Export
- Image Export – This option selects the image format the plot data will be exported as. The following image formats are available:
- EMF – Windows enhanced metafile.
- WMF – Windows metafile.
- BMP – Bitmap image file format.
- JPG – Joint photographic experts group file format.
- PNG – Portable network graphics file format.
- Text / Data – This option will export the data as a simple text file.
Export Destination
In this section, select where SMS will send the plot data when exporting.
- ClipBoard – Sends the plot data to the clipboard memory of the computer.
- File – Creates an ASCII text file of the data. Selecting the Browse button allows specifying the location where the file will be saved.
- Printer – Exports the data to an active printer.
Export Size
If exporting to an image format, allows the image size and resolution to be specified. This sections contains the following sections:
- Millimeters
- Inches
- Points
- Width
- DPI
- Large Font
Default values will be entered in these fields based on the generated plot. These values can be changed if desired.
Related Topics
SMS – Surface-water Modeling System | ||
|---|---|---|
| Modules: | 1D Grid • Cartesian Grid • Curvilinear Grid • GIS • Map • Mesh • Particle • Quadtree • Raster • Scatter • UGrid |  |
| General Models: | 3D Structure • FVCOM • Generic • PTM | |
| Coastal Models: | ADCIRC • BOUSS-2D • CGWAVE • CMS-Flow • CMS-Wave • GenCade • STWAVE • WAM | |
| Riverine/Estuarine Models: | AdH • HEC-RAS • HYDRO AS-2D • RMA2 • RMA4 • SRH-2D • TUFLOW • TUFLOW FV | |
| Aquaveo • SMS Tutorials • SMS Workflows | ||
