WMS:Quick Tour -HEC-1 - Time Area Curves: Difference between revisions
From XMS Wiki
Jump to navigationJump to search
No edit summary |
No edit summary |
||
| Line 2: | Line 2: | ||
[[Image:distancecontours.jpg]] [[Image:timearea.jpg]] | [[Image:distancecontours.jpg]] [[Image:timearea.jpg]] | ||
[[WMS:Quick Tour - HEC-1 - Storage Capacity Curves| '''< Previous''']] | [[WMS:Quick Tour -HEC-1 - Area Between Contours| ''' Next >''']] | [[WMS:Quick Tour - HEC-1 - Storage Capacity Curves| '''< Previous''']] | [[WMS:Quick Tour -HEC-1 - Area Between Contours| ''' Next >''']] | ||
{{WMSQuick}} | |||
[[Category:WMS Quick Tour|H]] | [[Category:WMS Quick Tour|H]] | ||
[[Category:HEC-1]] | [[Category:HEC-1]] | ||
Revision as of 16:00, 11 April 2017
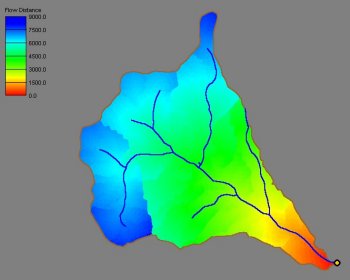
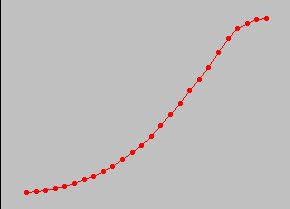
Time area curves are used in both the Clark and Snyder synthetic unit hydrograph methods. WMS computes the flow distance from each point on a TIN and then uses the approximation that travel time is directly related to travel distance to automatically compute a time-area curve for each basin.


