SMS:Floodway Tools
The SRH-2D floodway tools allow generating floodway simulations and evaluating the generated simulation.
Generate Floodway Simulation
The Generate Floodway Simulation tool aids in the creation of a new SRH-2D simulation for evaluating a floodway. The tool is accessed using the SRH-2D simulation right-click menu selecting the Tools | Generate Floodway Simulations command. Specifically it does the following:
- Create a modified Boundary Condition Coverage from the BC coverage in the original simulation. This modified BC coverage has all the same geometry as the original BC coverage. All water levels (such as Exit-H with specified values) are increased by the specified offset.
- (Note: this does not impact RC boundary conditions. These are dependent on the restrictions of the floodway and must be computed separately.)
- Duplicate the selected simulation
- The name of the new simulation is the same as the original simulation with (Floodway) appended.
- The model control parameters in the new simulation are identical to the original simulation, just as when the Duplicate command is used.
- The existing mesh, monitor and obstruction coverages from the original simulation are included in the floodway simulation.
- The modified BC coverage is swapped into the floodway simulation.
- (Note: no material coverage is inserted into the floodway simulation. The creation of this coverage requires that the floodway boundary be combined with the existing material coverage. This is currently a manual operation.)
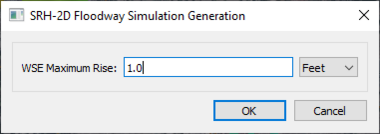
The tool will bring up the SRH-2D Floodway Simulation Generation dialog. The dialog has the following options:
- WSE Maximum Rise – The maximum rise for the water surface elevation in the floodway simulation. This value should be positive.
- Units – Set the units for the WSE maximum rise. The units should match the project units.
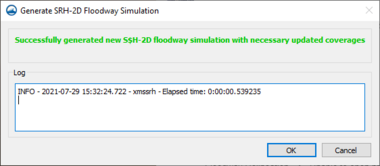
After completing the SRH-2D Floodway Simulation Generation dialog and clicking OK, the Generate SRH-2D Floodway Simulation dialog will appear showing the progress for the generation of the floodway simulation. If there are errors during the generation process, they will appear in this dialog. When the generation process proceeds successfully, a message will appear.
Generate Hydraulic Elevation Lines
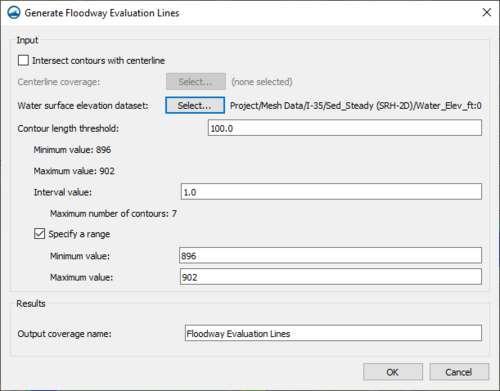
This tool is accessed using the SRH-2D simulation right-click menu selecting the Tools | Generate Hydraulic Evaluation Lines command. The tool will bring up the Generate Hydraulic Evaluation Lines dialog described below. The Generate Hydraulic Evaluation Lines tool creates a new Area Property coverage with arcs (pseudo cross sections) spaced along the floodplain with the intended purpose of comparing multiple simulations (such as a floodway simulation and a floodplain simulation) at the sections. This comparison can be done either with the Summary Table tool or the Compare Simulations tool. The generated arcs are derived to follow water level contours (isolines) at a user specified interval. By default, this interval is every 1 foot of water level. This approach has been discussed by several regulatory agencies as an approach to compare 2D hydrodynamic model results with 1D hydrodynamic model results in a compatible fashion. Since there is an implied averaging of results in a 1D simulation along cross sections, this set of evaluation lines provide a similar basis for averaging of 2D results for assessing impacts of proposed floodplain management procedures.
Methodology
The tool does the following:
- Loops through the specified range of contour values. For each value:
- Generate arcs for all contour segments with the current value.
- Delete closed loops.
- Connect the segment ends across voids in the solution data creating fewer (ideally just one) segment for the specified value.
- Delete segments that are shorter than a specified threshold length.
- If the option to use a centerline is enabled, delete all segments that do not intersect the centerline.
Input
- Intersect contours with centerline – If this option is enabled, the user must select a 1D Centerline coverage that can include a centerline arc. Any resulting evaluation line that does not intersect the centerline will be deleted. This eliminates segments in the corners or along the edge of the floodplain that do not mimic the cross section type attributes.
- Centerline Coverage – Clicking the Select button next to this option will bring up the Select Centerline Coverage dialog where a centerline can be selected to use during the evaluation line generation.
- Water surface elevation dataset – Clicking the Select button next to this option will bring up the Select WSE Dataset dialog where the water surface elevation dataset can be selected to use in the evaluation line generation. This dataset will determine the elevation of the evaluation lines. For transient datasets, a time step can be selected.
- Contour length threshhold – Sets a threshold for minimum segment length. Stand alone contour segments that are shorter than this length are deleted. This value is generally very small.
- Minimum value – This is the minimum water surface elevation value for the selected WSE dataset.
- Maximum value – This is the maximum water surface elevation value for the selected WSE dataset.
- Interval value – The user enters the desired water surface elevation interval between values.
- Maximum number of contours – This is the computed number of values based on the specified interval and the selected WSE dataset.
- Specify a range – Turn on this option to adjust the minimum and maximum range of values to be used. The min and max of the dataset (above) should be used as a guide. Normally, this would be used to control the placement of the sections to be at integer values.
- Minimum value – Set the minimum WSE value to be used.
- Maximum value – Set the maximum WSE value to be used.
- Contour length threshhold – Sets a threshold for minimum segment length. Stand alone contour segments that are shorter than this length are deleted. This value is generally very small.
Results
- Output coverage name – Enter a name for the coverage that will hold the evaluation lines.
Compare Simulation Data
The Compare Simulation Data generates a table comparing two simulations. A typical application would be to compare a floodway simulation to the base floodplain simulation.
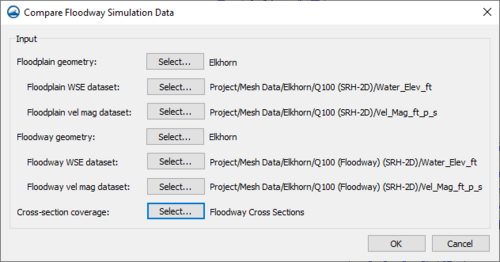
The tool is accessed using the SRH-2D simulation right-click menu selecting the Tools | Compare Simulation Data command. The tool will bring up the Compare Simulation Data dialog. The dialog has the following options:
- Base geometry – Clicking the Select button next to this option will bring up the Select Base Geometry dialog where a the base (i.e. floodplain) geometry (mesh, UGrid, etc.) used in the original simulation should be selected.
- Base WSE dataset – Clicking the Select button next to this option will bring up the Select WSE Dataset dialog where a the water surface dataset in the original simulation should be selected.
- Base vel mag dataset – Clicking the Select button next to this option will bring up the Select Velocity Magnitude Dataset dialog where a the velocity magnitude dataset in the original simulation should be selected.
- Alternate geometry – Clicking the Select button next to this option will bring up the Select Alternate Geometry dialog where a the alternate (i.e. floodway) geometry (mesh, UGrid, etc.) used in the alternate simulation should be selected.
- Alternate WSE dataset – Clicking the Select button next to this option will bring up the Select WSE Dataset dialog where a the water surface dataset in the floodway simulation should be selected.
- Alternate vel mag dataset – Clicking the Select button next to this option will bring up the Select Velocity Magnitude Dataset dialog where a the velocity magnitude dataset in the floodway simulation should be selected.
- Cross-section coverage – Clicking the Select button next to this option will bring up the Select Cross Section Coverage dialog where a the map coverage containing the evaluation lines can be selected.
The Compare Simulation Data table that is generated will show the following values:
|
|
Related Topics
| [hide] SMS – Surface-water Modeling System | ||
|---|---|---|
| Modules: | 1D Grid • Cartesian Grid • Curvilinear Grid • GIS • Map • Mesh • Particle • Quadtree • Raster • Scatter • UGrid |  |
| General Models: | 3D Structure • FVCOM • Generic • PTM | |
| Coastal Models: | ADCIRC • BOUSS-2D • CGWAVE • CMS-Flow • CMS-Wave • GenCade • STWAVE • WAM | |
| Riverine/Estuarine Models: | AdH • HEC-RAS • HYDRO AS-2D • RMA2 • RMA4 • SRH-2D • TUFLOW • TUFLOW FV | |
| Aquaveo • SMS Tutorials • SMS Workflows | ||


