GMS:Cross Sections: Difference between revisions
From XMS Wiki
Jump to navigationJump to search
No edit summary |
|||
| Line 25: | Line 25: | ||
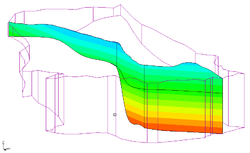
When cross sections are created from a mesh or a grid, values of the active scalar and vector datasets are interpolated to the cross sections. Whenever a new dataset is chosen as the active dataset for the mesh, the data values are re-interpolated to the cross sections. | When cross sections are created from a mesh or a grid, values of the active scalar and vector datasets are interpolated to the cross sections. Whenever a new dataset is chosen as the active dataset for the mesh, the data values are re-interpolated to the cross sections. | ||
The properties of all cross section data that GMS displays on the screen can be controlled through the ''Cross Sections'' tab of the ''Display Options'' dialog. This dialog is opened by right-clicking on the Cross Sections [[File:Cross Section Folder.svg|16 px]] entry in the [[GMS:Project Explorer|Project Explorer]] and selecting the '''Display Options''' command. It can also be accessed | The properties of all cross section data that GMS displays on the screen can be controlled through the ''Cross Sections'' tab of the ''Display Options'' dialog. This dialog is opened by right-clicking on the Cross Sections [[File:Cross Section Folder.svg|16 px]] entry in the [[GMS:Project Explorer|Project Explorer]] and selecting the '''Display Options''' command. It can also be accessed from the ''Display'' menu or the '''Display Options''' [[File:Display Options Macro.svg|16 px]] macro. The following describes the display options available for the cross sections. | ||
* ''Interior edge removal'' – By default, the lines representing the intersection of the cross section with the faces of the cells or elements are displayed on the cross section. These lines can be hidden by selecting the Interior edge removal option. | * ''Interior edge removal'' – By default, the lines representing the intersection of the cross section with the faces of the cells or elements are displayed on the cross section. These lines can be hidden by selecting the Interior edge removal option. | ||
* ''Cross section edges'' – Displays the lines that make up the cross section. | * ''Cross section edges'' – Displays the lines that make up the cross section. | ||
:The color of the | :The color of the cross section edges can be adjusted according to the following options: | ||
# Auto – Draws the material color if faces are not displayed. Uses black or white if the faces are displayed. The thickness and the line style can still be adjusted in the ''Line Properties'' dialog accessed through the button next to ''Cross section edges''. | # Auto – Draws the material color if faces are not displayed. Uses black or white if the faces are displayed. The thickness and the line style can still be adjusted in the ''Line Properties'' dialog accessed through the button next to ''Cross section edges''. | ||
# Specified – Uses the color specified next to ''Cross section edges''. | # Specified – Uses the color specified next to ''Cross section edges''. | ||
# Material – Displays the material color of the cell with the thickness and line style options of the | # Material – Displays the material color of the cell with the thickness and line style options of the ''Line Properties'' dialog. | ||
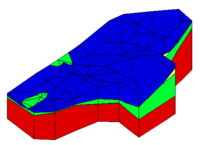
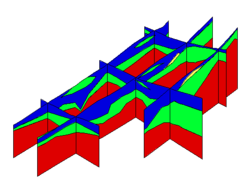
* ''Cross section faces'' – Displays each cross section as a set of filled polygons. The fill color corresponds to the material color of the corresponding geometry | * ''Cross section faces'' – Displays each cross section as a set of filled polygons. The fill color corresponds to the material color of the corresponding geometry | ||
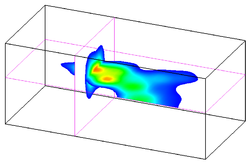
* ''Contours'' – Displays contours on the cross sections using the active scalar dataset. Available for both 3D Grid and UGrid. Clicking the '''Options''' button to the right opens the [[GMS:Contour Options|''Dataset Contour Options'']] dialog for setting the specifics of the contour display. | * ''Contours'' – Displays contours on the cross sections using the active scalar dataset. Available for both 3D Grid and UGrid. Clicking the '''Options''' button to the right opens the [[GMS:Contour Options|''Dataset Contour Options'']] dialog for setting the specifics of the contour display. | ||
| Line 39: | Line 39: | ||
==Convert Cross Section to Coverage== | ==Convert Cross Section to Coverage== | ||
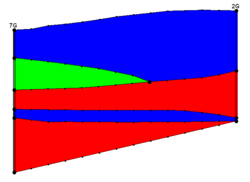
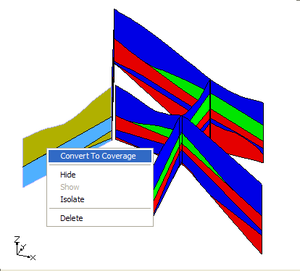
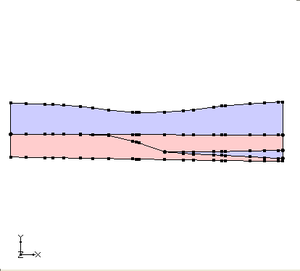
Cross sections can be converted to coverages by right-clicking on the | Cross sections can be converted to coverages by right-clicking on the cross section in the Project Explorer and selecting the '''Convert To Coverage''' command. The outer boundary of each material zone is converted into arcs and polygons are automatically built. | ||
{| border=0 | {| border=0 | ||
| Line 50: | Line 50: | ||
===Coordinate Transformation=== | ===Coordinate Transformation=== | ||
The coordinates of points from the cross section are transformed into the XY plane. The x coordinates are calculated relative to zero where zero is defined as one end of the cross section. Currently the end of the cross section that is designated as zero is the end with the minimum Y coordinate. If the cross section is horizontal then the end of the cross section with the minimum X is used. | The coordinates of points from the cross section are transformed into the XY plane. The x coordinates are calculated relative to zero where zero is defined as one end of the cross section. Currently the end of the cross section that is designated as zero is the end with the minimum Y coordinate.<!--If the cross section is horizontal then the end of the cross section with the minimum X is used.--> | ||
The x coordinates are calculated by finding the distance of the point from the end of the cross section that was set as zero. The Y coordinates are calculated by subtracting the minimum z value of the cross section from the z value of the point (y = z - z_min). | The x coordinates are calculated by finding the distance of the point from the end of the cross section that was set as zero. The Y coordinates are calculated by subtracting the minimum z value of the cross section from the z value of the point (y = z - z_min). | ||
