AHGW:Create Geophysical Plot Wizard
The Create Geophysical Plot Wizard dialog is accessed by clicking either ![]() Create Geophysical Plot or
Create Geophysical Plot or ![]() Create Geophysical Plot Wizard for Wells (depending on what options are desired) on the Arc Hydro Groundwater Toolbar. This tool helps create geophysical data plots for the selected section lines or wells in ArcGIS.
Create Geophysical Plot Wizard for Wells (depending on what options are desired) on the Arc Hydro Groundwater Toolbar. This tool helps create geophysical data plots for the selected section lines or wells in ArcGIS.
Cross Sections
When ![]() Create Geophysical Plot is clicked, the wizard contains the following steps:
Create Geophysical Plot is clicked, the wizard contains the following steps:
- Step 1: Cross Section Setup
- Step 2: Scale
- Step 3: Output Feature Classes
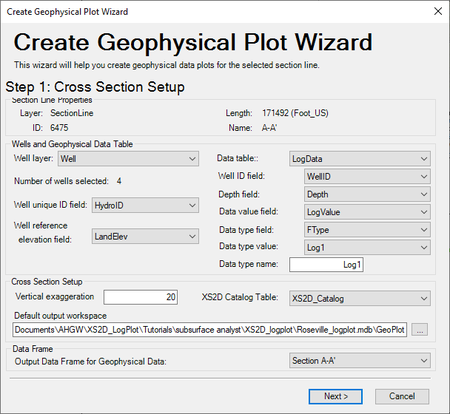
Cross Section Setup
The following sections, options, and fields are available:
- Section Line Properties section – Not user editable in this dialog. Displays the following properties
- Layer – The name of the layer.
- ID – The section line ID.
- Length – The length of the selected section line.
- Name – The name of the selected section line.
- Wells and Geophysical Data Table section
- Well Layer – Select the desired well layer from the drop-down.
- Number of wells selected – The number of wells currently selected.
- Well unique ID field – Select from the drop-down the unique ID field to use.
- Well reference elevation field – Select from the drop-down the well reference elevation field to use.
- Data table – Select the data table from the drop-down.
- Well ID field – Select the well ID field from the drop-down.
- Depth field – Select the depth field from the drop-down.
- Depth value field – Select the depth value field from the drop-down.
- Depth type field – Optional. Select the data fype field from the drop-down.
- Data type value – Required if Data type field ise set. Select an additional data type field from the drop-down.
- Data type name – Required if Data type field and Data type value are set. Enter a name for the data type.
- Cross Section Setup section
- Vertical exaggeration – Enter a decimal value for the vertical exaggeration.
- XS2D Catalog Table – Select the XS2D catalog from the drop-down.
- Default output workspace – Displays the absolute path to a default output workspace. Click
 to bring up the Select Output Workspace dialog where a workspace can be designated.
- Data Frame section
- Output Data Frame for Geophysical Data – Select the output data frame from the drop-down. In addition to "<Create new data frame>", other available data frames will be listed in the drop-down.
- Next – Switches to the second page of the Create Geophysical Plot Wizard dialog.
- Cancel – Cancels any changes and exits the Create Geophysical Plot Wizard dialog.
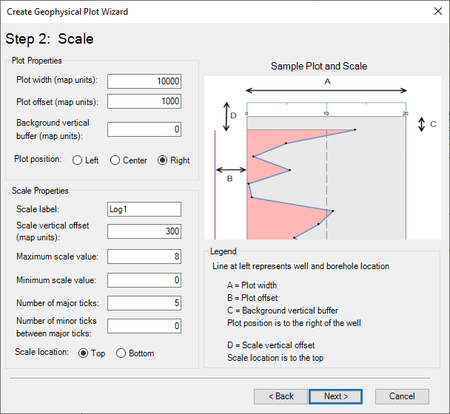
Scale (Cross Sections)
This step defines the plot and scale properties. The following sections, options, and fields are available:
- Plot Properties section – Values are in the units defined for the map (feet, meters, etc.).
- Plot width – Enter a decimal value.
- Plot offset – Enter a decimal value.
- Background vertical buffer – Enter a decimal value.
- Plot position – Select the desired radio button: Left, Center, or Right.
- Scale Properties section
- Scale label – Enter an alphanumeric label for the scale feature.
- Scale vertical offset – Enter a decimal value.
- Maximum scale value – Enter an integer for the maximum value for the scale.
- Minimum scale value – Enter an integer for the minimumvalue for the scale.
- Number of major ticks – Enter an integer for the number of major ticks on the scale bar.
- Number of minor ticks between major ticks – Enter an integer for the number of minor ticks between each set of major ticks on the scale bar.
- Scale location – Select the radio button indicating the location for the scale bar: Top or Bottom.
- Sample Plot and Scale section – Displays a sample plot and scale to be used with the information in the Legend section.
- Legend section – Explanation of the content of the Sample Plot and Scale section.
- Back – Switches back to the first page of the Create Geophysical Plot Wizard dialog.
- Next – Switches to the third page of the Create Geophysical Plot Wizard dialog.
- Cancel – Cancels any changes and exits the Create Geophysical Plot Wizard dialog.
Output Feature Classes
This step defines the output feature classes. The following sections, options, and fields are available:
- Log Feature Classes section
- Output log point feature class – Click
 to bring up the Save Log Point Features As dialog where a new feature class can be entered and saved.
 - Output log line feature class – Click
 to bring up the Save Log Line Features As dialog where a new feature class can be entered and saved.
 - Output log polygon feature class – Click
 to bring up the Save Log Polygon Features As dialog where a new feature class can be entered and saved.
- Output log point feature class – Click
- Scale Feature Classes section
- Output scale bar ticks feature class – Click
 to bring up the Save Scale Bar Features As dialog where a new feature class can be entered and saved.
 - Output scale major ticks feature class – Click
 to bring up the Save Scale Major Ticks Features As dialog where a new feature class can be entered and saved.
 - Output scale minor ticks feature class – Click
 to bring up the Save Scale Minor Ticks Features As dialog where a new feature class can be entered and saved.
 - Output scale vertical lines feature class – Click
 to bring up the Save Scale Vertical Lines Features As dialog where a new feature class can be entered and saved.
 - Output scale background polygon feature class – Click
 to bring up the Save Scale Background Polygon Features As dialog where a new feature class can be entered and saved.
- Output scale bar ticks feature class – Click
- Miscellaneous Options section
- Append new feature or overwrite – Select the radio button indicating whether new features should be appended to the existing features (Append) or whether the existing features should be overwritten (Overwrite existing feature with same data type).
- Back – Switches back to the second page of the Create Geophysical Plot Wizard dialog.
- Finish – Saves any changes and exits the Create Geophysical Plot Wizard dialog.
- Cancel – Cancels any changes and exits the Create Geophysical Plot Wizard dialog.
Wells
When ![]() Create Geophysical Plot Wizard for Wells is clicked, the wizard contains the following steps:
Create Geophysical Plot Wizard for Wells is clicked, the wizard contains the following steps:
- Step 1: Geophysical Plot Setup
- Step 2: Scale
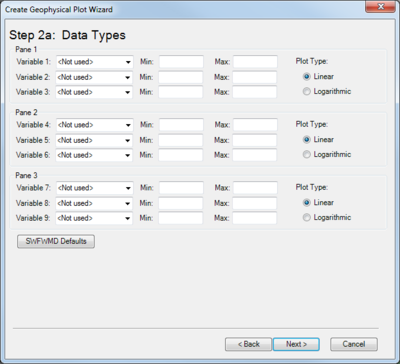
- Step 2a: Data Types
- Step 3: Output Feature Classes
- Step 4: Lithostratigraphy Hydrostratigraphy Display
Note: A well layer that follows the Arc Hydro Groundwater Schema must exist on the map prior to using this tool. A warning to this effect will appear if such a layer does not exist.
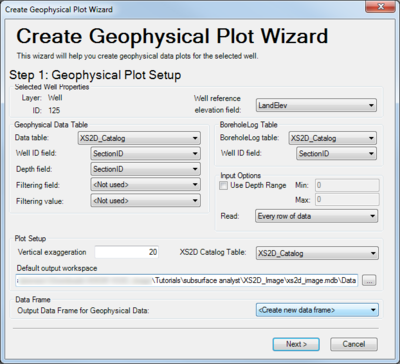
Geophysical Plot Setup
The following sections, options, and fields are available:
- Selected Well Properties section – Displays the Layer name and ID on the left. The following drop-down is on the right:
- Well reference elevation field – Select the desired field from the drop-down. The default selection is "LandElev".
- Geophysical Data Table section
- Data table – Select the desired data table from the drop-down. The default is "XS2D_Catalog".
- Well ID field – Select the field containing the Well ID.
- Depth field – Select the field containing depth data.
- Filtering field – Optional. Select a field to use for filtering the data. Default is "<not used>".
- Filtering value – Optional. Select a value to use for filtering the data. Default is "<not used>".
- BoreholeLog Table section
- BoreholeLog table – Select the desired table from the drop-down.
- Well ID field – Select the desired field from the drop-down. Options change based on available fields in the selected table (above option).
- Input Options section
- Use Depth Range – Turn on to enter a specific range to use.
- Min – Available if Use Depth Range is turned on. Enter a decimal minimum value for the range.
- Max – Available if Use Depth Range is turned on. Enter a decimal maximum value for the range.
- Read – Select from the drop-down which data rows to use (options range from "Every row of data" through "Every 20th row of data").
- Plot Setup section
- Vertical exaggeration –
- XS2D Catalog Table –
- Default output workspace –
- Data Frame section
- Output Data Frame for Geophysical Data – Select the output data frame from the drop-down. In addition to "<Create new data frame>", other available data frames will be listed in the drop-down.
- Next – Switches to the second page of the Create Geophysical Plot Wizard dialog.
- Cancel – Cancels any changes and exits the Create Geophysical Plot Wizard dialog.
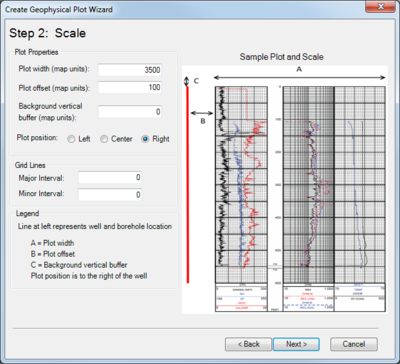
Scale (Wells)
The following sections, options, and fields are available:
- Plot Properties section
- Plot width – Enter a decimal value.
- Plot offset – Enter a decimal value.
- Background vertical buffer – Enter a decimal value.
- Plot position – Select the desired radio button: Left, Center, or Right.
- Grid Lines section
- Major Interval – Integer. The number of major interval gridlines.
- Minor Interval – Integer. The number of minor interval gridlines between each major interval gridline.
- Legend section – Explanation of the content of the Sample Plot and Scale section.
- Sample Plot and Scale section – Displays a sample plot and scale to be used with the information in the Legend section.
- Back – Switches back to the first page of the Create Geophysical Plot Wizard dialog.
- Next – Switches to page 2a of the Create Geophysical Plot Wizard dialog.
- Cancel – Cancels any changes and exits the Create Geophysical Plot Wizard dialog.
Data Types
The following sections, options, and fields are available:
- Pane 1 section
- Variable 1 through Variable 3 – Select a data type to use from the drop-down, and enter a Min and Max for each variable.
- Plot Type – Select the radio button for either Linear or Logarithmic.
- Pane 2 section
- Variable 4 through Variable 6 – Select a data type to use from the drop-down, and enter a Min and Max for each variable.
- Plot Type – Select the radio button for either Linear or Logarithmic.
- Pane 3 section
- Variable 7 through Variable 9 – Select a data type to use from the drop-down, and enter a Min and Max for each variable.
- Plot Type – Select the radio button for either Linear or Logarithmic.
- SWFWMD Defaults – Click to enter the defaults as set by the Southwest Florida Water Management District.
- Back – Switches back to the second page of the Create Geophysical Plot Wizard dialog.
- Next – Switches to the third page of the Create Geophysical Plot Wizard dialog.
- Cancel – Cancels any changes and exits the Create Geophysical Plot Wizard dialog.
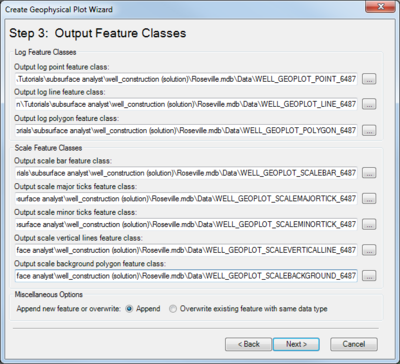
Output Feature Classes
The following sections, options, and fields are available:
- Log Feature Classes
- Log Feature Classes section
- Output log point feature class – Click
 to bring up the Save Log Point Features As dialog where a new feature class can be entered and saved.
 - Output log line feature class – Click
 to bring up the Save Log Line Features As dialog where a new feature class can be entered and saved.
 - Output log polygon feature class – Click
 to bring up the Save Log Polygon Features As dialog where a new feature class can be entered and saved.
- Output log point feature class – Click
- Scale Feature Classes section
- Output scale bar feature class – Click
 to bring up the Save Scale Bar Features As dialog where a new feature class can be entered and saved.
 - Output scale major ticks feature class – Click
 to bring up the Save Scale Major Ticks Features As dialog where a new feature class can be entered and saved.
 - Output scale minor ticks feature class – Click
 to bring up the Save Scale Minor Ticks Features As dialog where a new feature class can be entered and saved.
 - Output scale vertical lines feature class – Click
 to bring up the Save Scale Vertical Lines Features As dialog where a new feature class can be entered and saved.
 - Output scale background polygon feature class – Click
 to bring up the Save Scale Background Polygon Features As dialog where a new feature class can be entered and saved.
- Output scale bar feature class – Click
- Miscellaneous Options section
- Append new feature or overwrite – Select the radio button indicating whether new features should be appended to the existing features (Append) or whether the existing features should be overwritten (Overwrite existing feature with same data type).
- Back – Switches back to page 2a of the Create Geophysical Plot Wizard dialog.
- Next – Switches to the fourth page of the Create Geophysical Plot Wizard dialog.
- Cancel – Cancels any changes and exits the Create Geophysical Plot Wizard dialog.
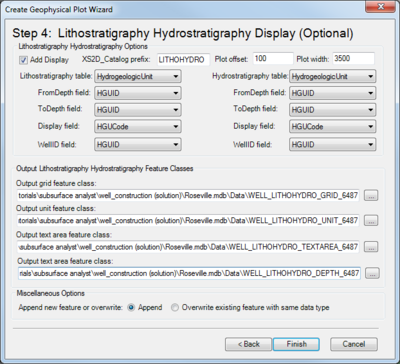
Lithostratigraphy Hydrostratigraphy Display
This page of the dialog is completely optional. If no changes are to be made on this page, simply click the Finish button at the bottom. The following sections, options, and fields are available:
- Lithostratigraphy Hydrostratigraphy Options
- Add Display – Turn this on to make the rest of the dialog page available. If it is turned off, no changes can be made.
- XS2D_Catalog prefix – Enter the alphanumeric prefix to add for any lithostratigraphic or hydrostratigraphic entries in the XS2D_Catalog.
- Plot offset – Enter a decimal amount for the offset.
- Plot width – Enter a decimal amount for the width of the plot.
- Lithostratigraphy table – Select from the drop-down the lithostratigraphy table.
- FromDepth field – Select from the drop-down the FromDepth field in the lithostratigraphy table.
- ToDepth field – Select from the drop-down the ToDepth field in the lithostratigraphy table.
- Display field – Select from the drop-down the Display field in the lithostratigraphy table.
- WellID field – Select from the drop-down the WellID field in the lithostratigraphy table.
- Hydrostratigraphy table – Select from the drop-down the hydrostratigraphy table.
- FromDepth field – Select from the drop-down the FromDepth field in the hydrostratigraphy table.
- ToDepth field – Select from the drop-down the ToDepth field in the hydrostratigraphy table.
- Display field – Select from the drop-down the Display field in the hydrostratigraphy table.
- WellID field – Select from the drop-down the WellID field in the hydrostratigraphy table.
- Output Lithostratigraphy Hydrostratigraphy Feature Classes
- Output grid feature class – Click
 to bring up the Save Grid Features As dialog where a new feature class can be entered and saved.
 - Output unit feature class – Click
 to bring up the Save Unit Features As dialog where a new feature class can be entered and saved.
 - Output text area feature class – Click
 to bring up the Save Stratigraphy Text Area Features As dialog where a new feature class can be entered and saved.
 - Output text area feature class – Click
 to bring up the Save Stratigraphy Depth Features As dialog where a new feature class can be entered and saved.
- Output grid feature class – Click
- Miscellaneous Options section
- Append new feature or overwrite – Select the radio button indicating whether new features should be appended to the existing features (Append) or whether the existing features should be overwritten (Overwrite existing feature with same data type).
- Back – Switches back to the third page of the Create Geophysical Plot Wizard dialog.
- Finish – Saves any changes and exits the Create Geophysical Plot Wizard dialog.
- Cancel – Cancels any changes and exits the Create Geophysical Plot Wizard dialog.
