SMS:Spatial Data Coverage: Difference between revisions
(Created page with 'The Spatial Data coverage is designed to store, visualize, and analyze various types of data at node locations. Most commonly, this data would consist of time series curves. Th...') |
No edit summary |
||
| Line 2: | Line 2: | ||
The following types of data are supported (right click options are described): | The following types of data are supported (right click options are described): | ||
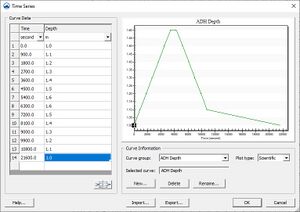
* [[Image:TimeSeriesEditor.jpg|thumb|300px|right|Time Series Editor]][[SMS:Time_Series|Time Series]] The time series editor allows the user to view, edit and import/export transient data sets for the location. Each time series consists of either a scalar value at each time, or a vector value at each time. The vector quantities may be defined as (X,Y)components or ((Magnitude,Direction) pairs. The time values may be displayed as dates or offset values. The time series are stored in a database inside SMS. When the project is saved, the series are saved in the XMDF project file. The series may also be imported/exported using a [[SMS:Time Series Data File|TSD file format.]]. | * [[Image:TimeSeriesEditor.jpg|thumb|300px|right|Time Series Editor]][[SMS:Time_Series|Time Series]] – The time series editor allows the user to view, edit and import/export transient data sets for the location. Each time series consists of either a scalar value at each time, or a vector value at each time. The vector quantities may be defined as (X,Y)components or ((Magnitude,Direction) pairs. The time values may be displayed as dates or offset values. The time series are stored in a database inside SMS. When the project is saved, the series are saved in the XMDF project file. The series may also be imported/exported using a [[SMS:Time Series Data File|TSD file format.]]. | ||
** Edit Data | ** Edit Data – This menu option invokes the time series editor. The list of time series curves available for this node are listed in a list box. The user selects the desired time series curve, and the values for that curve appear in the spread sheet. The selected time series data may be modified in this spread sheet. | ||
** View Data | ** View Data – This menu option operates like the Edit Data option, but the spread sheet is set to read only. This prevents accidental modification of the values in the time series. | ||
** Delete | ** Delete – This option removes the association between the selected time series and the spatial data node. The time series curve remains accessible in the Time Series database. | ||
* [[SMS:Compass_Plot|Compass Plot]] | * [[SMS:Compass_Plot|Compass Plot]] | ||
** Show Connection Lines | ** Show Connection Lines – This option allows the lines connecting the compass plot to its associated spatial data node to be enabled or disabled. | ||
** Properties... | ** Properties... – This option brings up the Compass Plot Properties dialog for the selected compass plot. | ||
** Delete | ** Delete – This option deletes the selected compass plot. | ||
The Spatial Data coverage type is found in the "Generic" coverage type list. | The Spatial Data coverage type is found in the "Generic" coverage type list. | ||
Revision as of 22:50, 25 October 2012
The Spatial Data coverage is designed to store, visualize, and analyze various types of data at node locations. Most commonly, this data would consist of time series curves. The data can be accessed or added to a node by the right-click menu of a single selected node. From this menu the data associated with the node can be created, viewed, modified, or deleted.
The following types of data are supported (right click options are described):
- Time Series – The time series editor allows the user to view, edit and import/export transient data sets for the location. Each time series consists of either a scalar value at each time, or a vector value at each time. The vector quantities may be defined as (X,Y)components or ((Magnitude,Direction) pairs. The time values may be displayed as dates or offset values. The time series are stored in a database inside SMS. When the project is saved, the series are saved in the XMDF project file. The series may also be imported/exported using a TSD file format..
- Edit Data – This menu option invokes the time series editor. The list of time series curves available for this node are listed in a list box. The user selects the desired time series curve, and the values for that curve appear in the spread sheet. The selected time series data may be modified in this spread sheet.
- View Data – This menu option operates like the Edit Data option, but the spread sheet is set to read only. This prevents accidental modification of the values in the time series.
- Delete – This option removes the association between the selected time series and the spatial data node. The time series curve remains accessible in the Time Series database.
- Compass Plot
- Show Connection Lines – This option allows the lines connecting the compass plot to its associated spatial data node to be enabled or disabled.
- Properties... – This option brings up the Compass Plot Properties dialog for the selected compass plot.
- Delete – This option deletes the selected compass plot.
The Spatial Data coverage type is found in the "Generic" coverage type list.
Related Topics
Modules: Mesh Module · Cartesian Grid Module · Scatter Module · Map Module · GIS Module · Particle Module
Models: ADCIRC · BOUSS-2D · CGWAVE · CMS-Flow · CMS-Wave · FESWMS · FVCOM · Generic Mesh Model · GENESIS · HYDRO AS-2D · PTM · SRH-2D · Steering · STWAVE · TABS · TUFLOW
