GMS:Calibration Targets: Difference between revisions
From XMS Wiki
Jump to navigationJump to search
No edit summary |
|||
| (19 intermediate revisions by 2 users not shown) | |||
| Line 1: | Line 1: | ||
{{Infobox Calibration}} | {{Infobox Calibration}} | ||
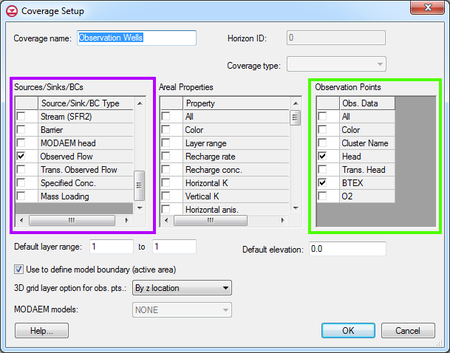
An observed value can be assigned to [[GMS:Feature_Objects|feature objects]]: points, arcs, arc groups and polygons in a coverage. Observation properties are edited in the [[GMS: | An observed value can be assigned to [[GMS:Feature_Objects|feature objects]]: points, arcs, arc groups and polygons in a coverage. Observation properties are edited in the [[GMS:Coverages#Coverage_Setup|''Coverage Setup'']] dialog. The figure shows the ''Coverage Setup'' dialog. Point observation properties are edited under the green highlighted section and flow observation properties are edited under the purple highlighted section. | ||
[[Image:CovSetupObs.png|center| | [[Image:CovSetupObs.png|thumb|center|450 px|''Coverage Setup'' dialog]] | ||
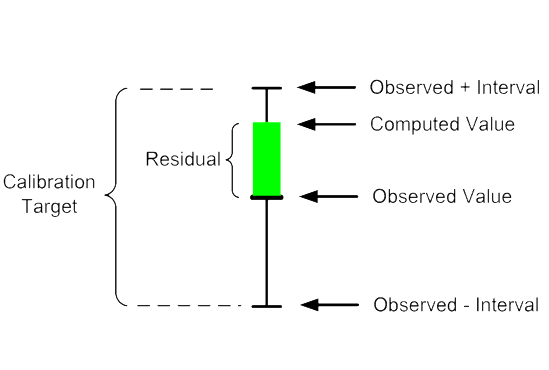
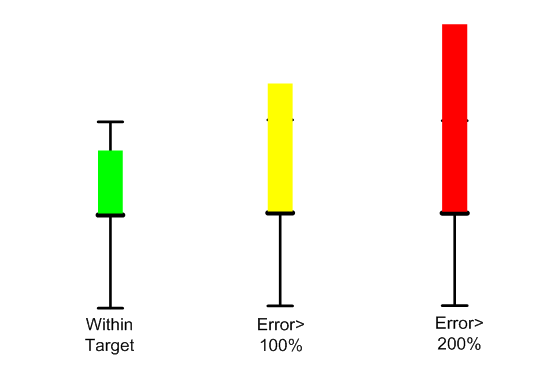
If an observed value has been assigned to a feature object, the calibration error at each object can be plotted using a "calibration target". A set of calibration targets provides useful feedback on the magnitude, direction (high, low), and spatial distribution of the calibration error. The components of a calibration target are illustrated in the following figure. The center of the target corresponds to the observed value. The top of the target corresponds to the observed value plus the interval and the bottom corresponds to the observed value minus the interval. | If an observed value has been assigned to a feature object, the calibration error at each object can be plotted using a "calibration target". A set of calibration targets provides useful feedback on the magnitude, direction (high, low), and spatial distribution of the calibration error. The components of a calibration target are illustrated in the following figure. The center of the target corresponds to the observed value. The top of the target corresponds to the observed value plus the interval and the bottom corresponds to the observed value minus the interval. The colored bar represents the error. If the bar lies entirely within the target, the color bar is drawn in green. If the bar is outside the target, but the error is less than 200%, the bar is drawn in yellow. If the error is greater than 200%, the bar is drawn in red. The display options related to calibration targets are specified in the [[GMS:Feature Object Display Options|''Feature Object Display Options'']] dialog. | ||
<gallery mode="packed" heights="250 px"> | |||
Image:Calibtarget1.png|Example of a calibration target | |||
Image:ObsTarget2.png|Observation target error bars | |||
</gallery> | |||
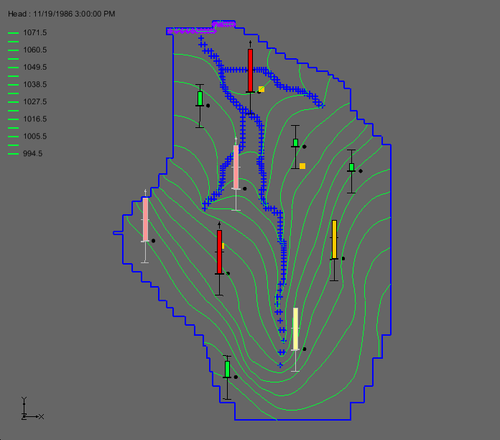
GMS also supports transient observation data. Often, the measured times of the field observations do not match the output times of the model. When this occurs GMS will linearly interpolate the observed value at the model output time in order to display an observation target. If the model output time is before the first observed time or after the last observed time then the target is drawn in a "washed out" (or lighter) color for that particular observation. | |||
If the | |||
[[Image:CalibTrans.png|thumb|center|500 px|Transient observations]] | |||
==See also== | ==See also== | ||
| Line 20: | Line 22: | ||
[[Category:Calibration]] | [[Category:Calibration]] | ||
[[Category:Gallery]] | |||


