HY8:Culvert Summary: Difference between revisions
From XMS Wiki
Jump to navigationJump to search
No edit summary |
No edit summary |
||
| (4 intermediate revisions by the same user not shown) | |||
| Line 1: | Line 1: | ||
The culvert summary table shows the performance table for each culvert in the crossing. Each culvert's properties can be viewed by selecting the desired culvert from the drop-down list. The following properties are represented in the table: | The culvert summary table shows the performance table for each culvert in the crossing. Each culvert's properties can be viewed by selecting the desired culvert from the drop-down list. The following properties are represented in the table: | ||
* '''Total Discharge''': Total discharge at the culvert crossing | * '''Total Discharge''': Total discharge at the culvert crossing | ||
| Line 15: | Line 13: | ||
* '''Outlet Velocity''': Velocity at the culvert outlet | * '''Outlet Velocity''': Velocity at the culvert outlet | ||
* '''Tailwater Velocity''':Velocity in downstream channel | * '''Tailwater Velocity''':Velocity in downstream channel | ||
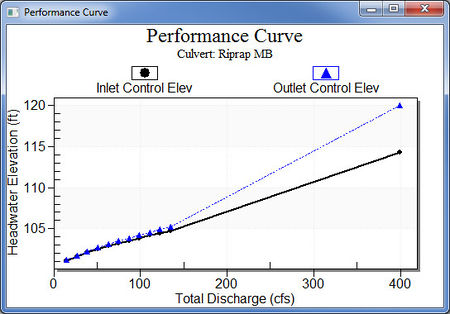
In the table, bold values indicate inlet or outlet controlling depths, where the bolded value indicates whether the inlet or outlet has the greatest headwater elevation as shown in the performance curve. Within the culvert summary option, plot the performance curve for each culvert in the crossing. A sample performance curve is displayed in the figure below. | |||
[[Image:HY8image45.jpg]] | [[Image:HY8image45.jpg|450 px]] | ||
| Line 28: | Line 23: | ||
[[Category:HY-8 Analysis|C]] | [[Category:HY-8 Analysis|C]] | ||
[[Category:Culvert Data|C]] | [[Category:Culvert Data|C]] | ||
[[Category:HY-8 Dialogs]] | [[Category:HY-8 Dialogs|Culvert]] | ||
Latest revision as of 18:26, 10 April 2017
The culvert summary table shows the performance table for each culvert in the crossing. Each culvert's properties can be viewed by selecting the desired culvert from the drop-down list. The following properties are represented in the table:
- Total Discharge: Total discharge at the culvert crossing
- Culvert Discharge: Amount of discharge that passes through the selected culvert barrel(s)
- Headwater Elevation: Computed headwater elevation at the inlet of the culvert(s)
- Inlet Control Depth: Inlet control headwater depth above inlet invert
- Outlet Control Depth: Outlet control headwater depth above inlet invert
- Flow Type: USGS flow type 1 through 7 is indicated and the associated profile shape and boundary condition. Press the Flow Types button for a summary of Flow Types.
- Normal Depth: Normal depth in the culvert. If the culvert capacity is insufficient to convey flow at normal depth, normal depth is set equal to the barrel height.
- Critical Depth: Critical depth in culvert. If the culvert capacity is insufficient to convey flow at critical depth, critical depth is set equal to the barrel height.
- Outlet Depth: Depth at culvert outlet
- Tailwater Depth:Depth in downstream channel
- Outlet Velocity: Velocity at the culvert outlet
- Tailwater Velocity:Velocity in downstream channel
In the table, bold values indicate inlet or outlet controlling depths, where the bolded value indicates whether the inlet or outlet has the greatest headwater elevation as shown in the performance curve. Within the culvert summary option, plot the performance curve for each culvert in the crossing. A sample performance curve is displayed in the figure below.
