WMS:SMPDBK Post Processing: Difference between revisions
From XMS Wiki
Jump to navigationJump to search
No edit summary |
No edit summary |
||
| (28 intermediate revisions by the same user not shown) | |||
| Line 1: | Line 1: | ||
To view results of an SMPDBK analysis, | To view results of an SMPDBK analysis, perform the following steps: | ||
#Run the simulation by selecting '''Run Simulation''' in the ''SMPDBK'' menu. | |||
#Using the Map Module, interpolate the water surface elevations in the 1D Hyd Centerline and 1D Hyd Cross Section coverages. This can be done by selecting each coverage to make it active and then selecting '''Interpolate Water Surface Elevations''' from the ''River Tools'' menu. | |||
#Go to the Terrain Data module and use ''Flood'' | '''Delineate''' to delineate the floodplain. | |||
#In ''Display Options'', turn on the contours. Turning on color filled contours with transparency and a background image (a contour map or an aerial photograph) will help better visualize the flood extents. | |||
#If there are areas known to be interpolated incorrectly and are not flooded (see Figure 1), draw a polygon around these regions so the floodplain will not be delineated in these areas. Remove these areas from the floodplain delineation by creating a Flood Barrier coverage (see Figure 2 below) and then delineating the floodplain again using the ''User defined flood barrier coverage'' option (see Figure 3 below). | |||
<gallery mode="packed" heights="300px"> | |||
File:SMPDBK Floodplain Delineation1.jpg|''Figure 1'' – Areas known to be interpolated incorrectly and are not flooded. | |||
File:SMPDBK Floodplain Delineation2.jpg|''Figure 2'' – A flood barrier coverage. | |||
File:SMPDBK Floodplain Delineation3.jpg|''Figure 3'' – Floodplan Delineation dialog. | |||
</gallery> | |||
==Related Topics== | ==Related Topics== | ||
* [[WMS:SMPDBK|Simplified Dam-Break Analysis]] | * [[WMS:SMPDBK|Simplified Dam-Break Analysis]] | ||
* [[WMS:Interpolating Hydraulic Model Results|Interpolate Results]] | * [[WMS:Interpolating Hydraulic Model Results|Interpolate Results]] | ||
* [[WMS:Overview of | * [[WMS:Overview of Floodplain Delineation|Floodplain Delineation]] | ||
{{WMSMain}} | {{WMSMain}} | ||
[[Category:SMPDBK|P]] | |||
[[Category:SMPDBK Dialogs|P]] | |||
[[Category:Gallery]] | |||
Latest revision as of 23:50, 12 December 2017
To view results of an SMPDBK analysis, perform the following steps:
- Run the simulation by selecting Run Simulation in the SMPDBK menu.
- Using the Map Module, interpolate the water surface elevations in the 1D Hyd Centerline and 1D Hyd Cross Section coverages. This can be done by selecting each coverage to make it active and then selecting Interpolate Water Surface Elevations from the River Tools menu.
- Go to the Terrain Data module and use Flood | Delineate to delineate the floodplain.
- In Display Options, turn on the contours. Turning on color filled contours with transparency and a background image (a contour map or an aerial photograph) will help better visualize the flood extents.
- If there are areas known to be interpolated incorrectly and are not flooded (see Figure 1), draw a polygon around these regions so the floodplain will not be delineated in these areas. Remove these areas from the floodplain delineation by creating a Flood Barrier coverage (see Figure 2 below) and then delineating the floodplain again using the User defined flood barrier coverage option (see Figure 3 below).
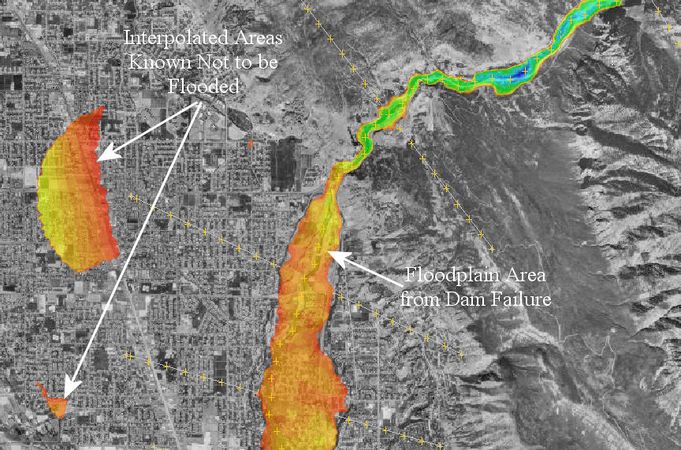
Figure 1 – Areas known to be interpolated incorrectly and are not flooded.
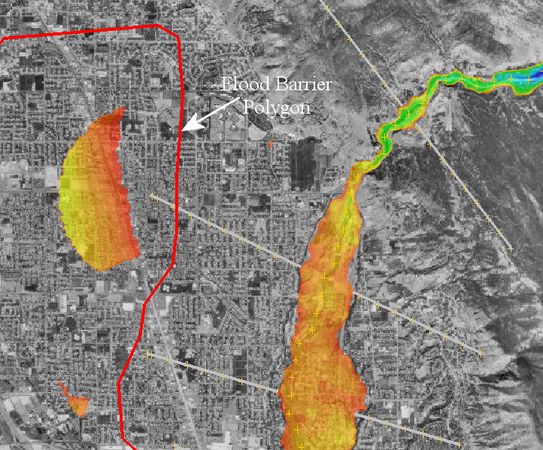
Figure 2 – A flood barrier coverage.
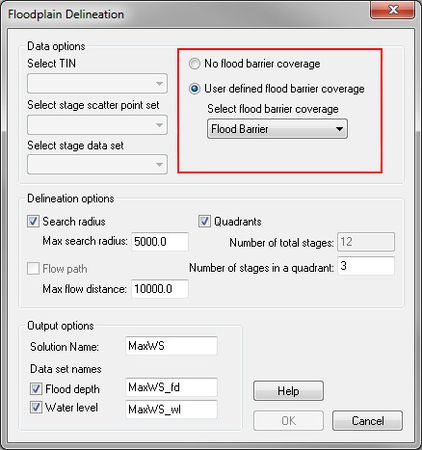
Figure 3 – Floodplan Delineation dialog.


Related Topics
WMS – Watershed Modeling System | ||
|---|---|---|
| Modules: | Terrain Data • Drainage • Map • Hydrologic Modeling • River • GIS • 2D Grid • 2D Scatter |  |
| Models: | CE-QUAL-W2 • GSSHA • HEC-1 • HEC-HMS • HEC-RAS • HSPF • MODRAT • NSS • OC Hydrograph • OC Rational • Rational • River Tools • Storm Drain • SMPDBK • SWMM • TR-20 • TR-55 | |
| Toolbars: | Modules • Macros • Units • Digitize • Static Tools • Dynamic Tools • Drawing • Get Data Tools | |
| Aquaveo | ||