Raster Options
XMS software provides a number of options for importing and displaying raster data.
Importing Rasters
Import a raster file by selecting Open in the File menu. Select the proper raster file as shown in the following table. Select Open. At the popup Load it as..., select DEM.
| Format | File to Open | Source | Importance | Level of Support |
|---|---|---|---|---|
| ArcInfo Binary Grid | w001001.adf | ESRI | 1 | Supported in GMS and in SMS |
| ArcInfo Ascii Grid | *.asc | ESRI | 2 | Supported in GMS and in SMS |
| USGS DEM Grid Float | *.flt | http://seamless.usgs.gov | 2 | Supported in GMS and in SMS |
| USGS NED Grid Float | *.flt | http://seamless.usgs.gov | 2 | Supported in GMS and in SMS |
| Canadian DEM | *.dem | http://www.geobase.ca | 3 | Supported in GMS and supported in SMS |
| DTED | *.dt0 | ERDC | 3 | Supported in GMS and supported in SMS |
| Aster DEM | *.tif | https://asterweb.jpl.nasa.gov/gdem.asp | 4 | Supported in GMS and supported in SMS as images |
| SDTS | *.ddf | http://data.geocomm.com/dem/demdownload.html | 5 | Supported in GMS and supported in SMS |
How to export TINs in ADF format from ArcGIS in a format that XMS will read
- Load the TIN into ArcMap
- Expand the 3D Analyst Tools | Conversion Tools | From TIN toolset in ArcToolbox
- Double-click the TIN to Raster tool in ArcToolbox (specify your current TIN file in the Input TIN field). Make a note of the path in the Output Raster field.
- Expand the Conversion Tools | From Raster toolset in ArcToolbox
- Double-click the Raster to ASCII tool in ArcToolbox (specify the raster file that you created in the previous step as the input raster, and make a note of the path for the output file)
- Open Windows Explorer (My Computer) and browse to the location of the ASCII *.txt file output in step 5
- Make a copy of the *.txt file created in step 5
- Change the extension of the *.txt file to *.dem
- Open the *.dem file in WMS
Raster Display Options
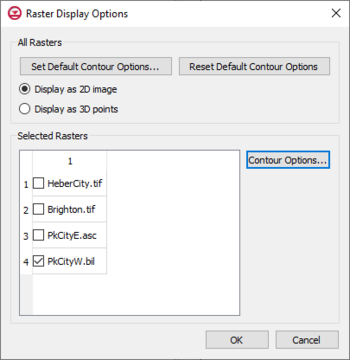
The Raster Display Options dialog is used to change the way rasters are displayed. This dialog is accessed by right-clicking on a raster file in the Project Explorer and selecting the Display Options command.
DEMs are imported and displayed as either 2D images or as a 3D point cloud.
The Raster Display Options dialog has the following options:
- Set Default Contour Options – This button will open a Contour Options dialog that will set contour options for all raster files in the project. Clicking the Color Ramp button in the Contour Options dialog will open the Color dialog. When accessing the Color dialog through this process, the differnet shader options are available.
- Reset Default Contour Options – Clicking this will restore the contour options to the default options/factory condition.
- Display as 2D Image – If displaying as a 2D image, the raster is only visible in plan view (like other images). This option is fast and memory efficient and can support large rasters (or several rasters). Hill shading, which enables shadows and thus makes the image appear 3D, is available in this mode.
- Display as 3D Points – If displaying as 3D points, the raster is visible in any view, not just plan view. 3D points are also very memory efficient but may be a little slower than the 2D image option. Also, hill shading is not available in this mode. The point size and the maximum number of points to display can be specified. Specifying a maximum number of points can be useful if the size of the raster is such that rendering becomes slow.
- Selected Rasters – This list will show all rasters that have been imported into the project.
- Contour Options – This button will open a Contour Options dialog that will set contour options for the selected raster files in the project. Clicking the Color Ramp button in the Contour Options dialog will open the Color dialog. When accessing the Color dialog through this process, the differnet shader options are available.
Shaders
With either 2D or 3D, four different shaders, which control the color ramp, are available. A color legend can be displayed to relate colors with values. To view shading, use the Lighting display options.
| [hide] GMS – Groundwater Modeling System | ||
|---|---|---|
| Modules: | 2D Grid • 2D Mesh • 2D Scatter Point • 3D Grid • 3D Mesh • 3D Scatter Point • Boreholes • GIS • Map • Solid • TINs • UGrids | |
| Models: | FEFLOW • FEMWATER • HydroGeoSphere • MODAEM • MODFLOW • MODPATH • mod-PATH3DU • MT3DMS • MT3D-USGS • PEST • PHT3D • RT3D • SEAM3D • SEAWAT • SEEP2D • T-PROGS • ZONEBUDGET | |
| Aquaveo | ||
| [hide] SMS – Surface-water Modeling System | ||
|---|---|---|
| Modules: | 1D Grid • Cartesian Grid • Curvilinear Grid • GIS • Map • Mesh • Particle • Quadtree • Raster • Scatter • UGrid |  |
| General Models: | 3D Structure • FVCOM • Generic • PTM | |
| Coastal Models: | ADCIRC • BOUSS-2D • CGWAVE • CMS-Flow • CMS-Wave • GenCade • STWAVE • WAM | |
| Riverine/Estuarine Models: | AdH • HEC-RAS • HYDRO AS-2D • RMA2 • RMA4 • SRH-2D • TUFLOW • TUFLOW FV | |
| Aquaveo • SMS Tutorials • SMS Workflows | ||
