WMS:Rational Method Rainfall Intensity
Precipitation intensity-duration-frequency (IDF) information is necessary for the specific locality in which the Rational Method will be used. In general this is done using either HYDRO-35 or NOAA Atlas 2 data. Using the IDF Curves… button (for either basins or outlets), WMS can be used to develop curves from either of these two data sources, statistically derived data, or directly entering an i value if typically computed in another way or the design value to use is already known.
The IDF Computation dialog (shown below) can be used to create a series of T-year IDF curves from HYDRO-35, NOAA Atlas 2, or user defined data.

The type of data that will be used to create the IDF curves is specified with the radio group options in the upper left portion of the dialog. The Define Data button can then be used to bring a dialog which allows entering the following values, depending on the data type specified:
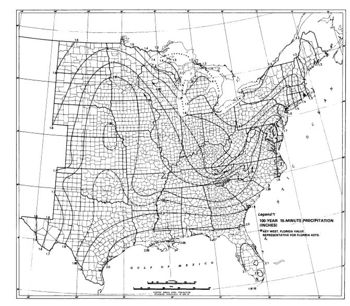
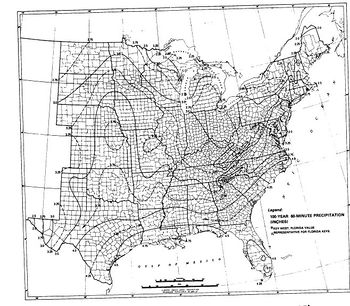
- HYDRO-35 – The 2-yr 5, 15, and 60 minute rainfall values, and the 100-yr 5, 15, and 60 minute rainfall values. The HYDRO-35 maps for determining the six required rainfall values have been included below.
- NOAA Atlas 2 – The 2-yr 6 and 24 hour rainfall values, the 100-yr 6 and 24 hr rainfall values and the mean basin elevation. When entering rainfall values they are entered as depth values and not intensity values.
- User Defined – The recurrence interval, and the 5, 10, 15, 30 and 60 minute rainfall values. With this option only a single curve for the recurrence interval will be generated.
The methods WMS uses to compute the IDF curve equations are discussed in Appendix A of FHWA HEC-12 and in FHWA HDS-2.
Once the specified data has been entered the corresponding IDF-curves will be generated and plotted in the graphics window of the IDF Computation dialog. Then specify the recurrence interval to use for analysis by selecting it in the text list window in the upper right portion of the dialog. After selecting the recurrence interval, the appropriate curve in the plot window will be displayed in red. Finally, an intensity value, i, is determined by specifying a time of concentration as outlined below and then clicking on the Intensity button. When clicking on the Done button for the IDF Computation dialog, the computed intensity value will automatically be updated in the edit field for i of the Rational Method dialog.
Computing the Time of Concentration
A time of concentration value needs to be entered in order to determine the intensity value to be used in the Rational Method equation. This value can either be entered manually or computed from the overland flow length, Manning’s n, and slope. One equation used to compute the time of concentration from basin geometric parameters is the kinematic wave equation:

- where:
- tc = The time of concentration.
- L = Overland flow length.
- n = Manning’s roughness coefficient.
- i = Rainfall intensity.
- S = Average slope of the overland area.
- K = 0.93
This method has been adopted by the FHWA for general use, but other equations can be used as defined elsewhere
HYDRO-35 Maps
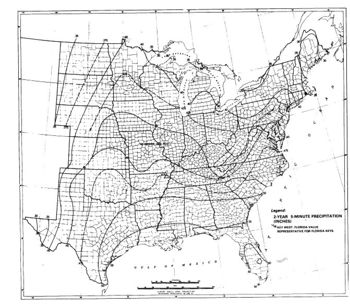
2 years 5 minutes
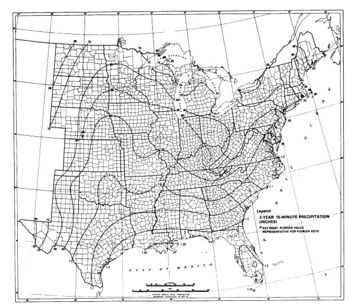
2 years 15 minutes
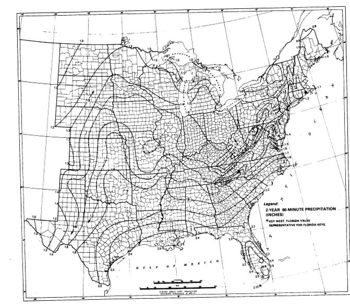
2 years 60 minutes
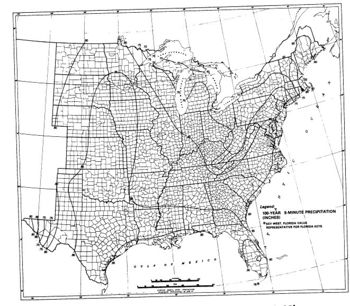
100 years 5 minutes
100 years 15 minutes
100 years 60 minutes


Related Topics
WMS – Watershed Modeling System | ||
|---|---|---|
| Modules: | Terrain Data • Drainage • Map • Hydrologic Modeling • River • GIS • 2D Grid • 2D Scatter |  |
| Models: | CE-QUAL-W2 • GSSHA • HEC-1 • HEC-HMS • HEC-RAS • HSPF • MODRAT • NSS • OC Hydrograph • OC Rational • Rational • River Tools • Storm Drain • SMPDBK • SWMM • TR-20 • TR-55 | |
| Toolbars: | Modules • Macros • Units • Digitize • Static Tools • Dynamic Tools • Drawing • Get Data Tools | |
| Aquaveo | ||