GMS:The GMS Window: Difference between revisions
| (30 intermediate revisions by 4 users not shown) | |||
| Line 1: | Line 1: | ||
The GMS window is divided into seven main sections: | |||
The GMS window | [[Image:GMS_screen.png|thumb|600px|The GMS window with different parts labeled.]] | ||
==Menus== | |||
The [[GMS:File Menu|''File'']], [[GMS:Edit Menu|''Edit'']], [[GMS:Display Menu|''Display'']], [[GMS:Window Menu|''Window'']] and [[GMS:Help Menu|''Help'']] menus are always available. Other menus change based on the [[GMS:What_Is_GMS#Modules|module]] or [[GMS:What_Is_GMS#Numerical Models|numerical model]] in use. | |||
==Toolbars== | |||
For a full description of all the toolbars, see [[GMS:Toolbars|Toolbars]]. | |||
===Shortcut Toolbars=== | |||
The [[GMS:Toolbars|shortcut toolbars]] are shortcuts (sometimes referred to as "macros") to often used menu commands. | |||
=== | ===Module toolbar=== | ||
The | The module toolbar let's switching between [[GMS:What_Is_GMS#Modules|modules]]. | ||
==XYZF Bar== | |||
These fields are used to edit the coordinates and scalar data set values of selected items (vertices, nodes, scatter points, etc.). | These fields are used to edit the coordinates and scalar data set values of selected items (vertices, nodes, scatter points, etc.). | ||
[[ | :[[File:XYZF Edit Bar Window.png]] | ||
== | ==Project Explorer== | ||
The [[GMS: | {{only in print| [[Image:Tree_General.jpg|200px|right]]}} | ||
The [[GMS:Project Explorer|Project Explorer]] contains a hierarchical representation of the data associated with a modeling project. | |||
:[[Image:Tree_General.jpg|thumb|none|left|200px|Example of the [[GMS:Project Explorer|''Project Explorer'']] ]] | |||
== | ==Static and Dynamic Tools== | ||
The static and dynamic tools change the behavior of the mouse in the Graphics Window. The static tools are the same for every module and the dynamic tools change depending on the module. The dynamic tools typically are for creation or selection of objects. | |||
=== | ==Graphics Window== | ||
The Graphics Window is where data is rendered and data is manipulated using tools. | |||
The | |||
===Mouse Tracking Bar=== | |||
This shows the real world coordinates of the mouse in the Graphics Window. If the mouse is over a cell, triangle or element, the F value is the dataset scalar value and the ID is the object's number. For 3D Grids, the IJK of the cell is also shown. The progress bar is also found here. | |||
===Selection Echo=== | |||
This allows quickly viewing the properties of a selected object, point, node, cell, or element. | |||
==Status Bar== | |||
The ''Status Bar'' is used to display messages and information about selected items. It also shows the [[Projections#Display_Projection|display projection]]. | The ''Status Bar'' is used to display messages and information about selected items. It also shows the [[Projections#Display_Projection|display projection]]. | ||
[[Image:StatusBar. | :[[Image:StatusBar.png|700 px]] | ||
==Time Steps Window== | |||
The ''Time Steps'' window is available only when a dataset containing a time series is active in the Project Explorer. The window allows selecting individual time steps for display in the Graphics Window. The window is usually located beneath the Project Explorer, but is can be resized and/or unpinned to be it's own window. | |||
:[[File:GMSTimeStepWindow.jpg|thumb|none|Example of the ''Time Steps'' window.]] | |||
{{Navbox GMS}} | {{Navbox GMS}} | ||
[[Category:GMS General Information]] | [[Category:GMS General Information]] | ||
[[Category:GMS Layout|Window]] | |||
Latest revision as of 14:21, 23 October 2017
The GMS window is divided into seven main sections:

Menus
The File, Edit, Display, Window and Help menus are always available. Other menus change based on the module or numerical model in use.
Toolbars
For a full description of all the toolbars, see Toolbars.
Shortcut Toolbars
The shortcut toolbars are shortcuts (sometimes referred to as "macros") to often used menu commands.
Module toolbar
The module toolbar let's switching between modules.
XYZF Bar
These fields are used to edit the coordinates and scalar data set values of selected items (vertices, nodes, scatter points, etc.).
Project Explorer
The Project Explorer contains a hierarchical representation of the data associated with a modeling project.
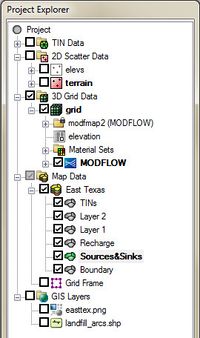 Example of the Project Explorer

Static and Dynamic Tools
The static and dynamic tools change the behavior of the mouse in the Graphics Window. The static tools are the same for every module and the dynamic tools change depending on the module. The dynamic tools typically are for creation or selection of objects.
Graphics Window
The Graphics Window is where data is rendered and data is manipulated using tools.
Mouse Tracking Bar
This shows the real world coordinates of the mouse in the Graphics Window. If the mouse is over a cell, triangle or element, the F value is the dataset scalar value and the ID is the object's number. For 3D Grids, the IJK of the cell is also shown. The progress bar is also found here.
Selection Echo
This allows quickly viewing the properties of a selected object, point, node, cell, or element.
Status Bar
The Status Bar is used to display messages and information about selected items. It also shows the display projection.
Time Steps Window
The Time Steps window is available only when a dataset containing a time series is active in the Project Explorer. The window allows selecting individual time steps for display in the Graphics Window. The window is usually located beneath the Project Explorer, but is can be resized and/or unpinned to be it's own window.

GMS – Groundwater Modeling System | ||
|---|---|---|
| Modules: | 2D Grid • 2D Mesh • 2D Scatter Point • 3D Grid • 3D Mesh • 3D Scatter Point • Boreholes • GIS • Map • Solid • TINs • UGrids | |
| Models: | FEFLOW • FEMWATER • HydroGeoSphere • MODAEM • MODFLOW • MODPATH • mod-PATH3DU • MT3DMS • MT3D-USGS • PEST • PHT3D • RT3D • SEAM3D • SEAWAT • SEEP2D • T-PROGS • ZONEBUDGET | |
| Aquaveo | ||