GMS:Model Calibration: Difference between revisions
From XMS Wiki
Jump to navigationJump to search
No edit summary |
No edit summary |
||
| Line 8: | Line 8: | ||
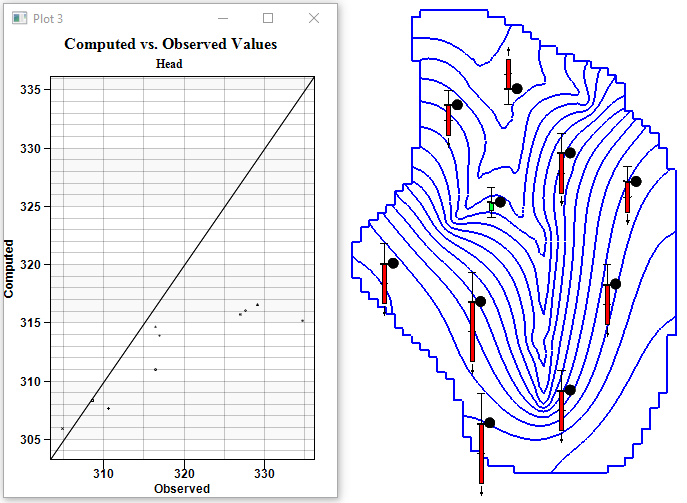
Once a set of observed point and flow values has been entered, each time a model solution is imported, GMS automatically interpolates the computed solution to the observation points. For some models ([[GMS:MODFLOW|MODFLOW]]) the model outputs the computed values at the observation points. Also, MODFLOW outputs the computed flow for the flow observations. A calibration target representing the magnitude of the residual error is displayed next to each observation point and each flow object as shown below. The size of the target is based on the confidence interval or the standard deviation. In addition to the calibration targets next to the observation points, you can choose to display any of a number of statistical [[GMS:Plot_Wizard|plots]]. | Once a set of observed point and flow values has been entered, each time a model solution is imported, GMS automatically interpolates the computed solution to the observation points. For some models ([[GMS:MODFLOW|MODFLOW]]) the model outputs the computed values at the observation points. Also, MODFLOW outputs the computed flow for the flow observations. A calibration target representing the magnitude of the residual error is displayed next to each observation point and each flow object as shown below. The size of the target is based on the confidence interval or the standard deviation. In addition to the calibration targets next to the observation points, you can choose to display any of a number of statistical [[GMS:Plot_Wizard|plots]]. | ||
[[Image:calib_plot.jpg|frame|center|Calibration Targets and Plots of Calibration Statistics.| | [[Image:calib_plot.jpg|frame|center|Calibration Targets and Plots of Calibration Statistics.|400px]] | ||
{{Navbox GMS}} | {{Navbox GMS}} | ||
[[Category:Calibration]] | [[Category:Calibration]] | ||
