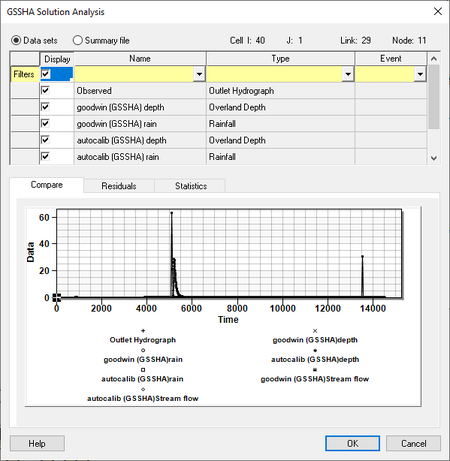
WMS:GSSHA Solution Analysis

The GSSHA Solution Analysis dialog is primarily used for manual calibration as well as visualizing solution results. It is accessed by clicking the ![]() button in the Solution Results column in the GSSHA feature points/nodes Properties dialog.
button in the Solution Results column in the GSSHA feature points/nodes Properties dialog.
At the top of the dialog are the following options and information areas:
- Datasets – Uses the observations as well as gridded and link/node datasets as part of the displayed data shown on the tabs. Any dataset shown in the spreadsheet with the Display turned on is used for generating the Compare and Residuals plots and for computing Statistics using the residuals.
- Summary file – Uses the stored WMS summary file data in the plots shown. The results for each event of the simulations is stored in WMS and shown in the spreadsheet. The observations are also listed in the spreadsheet, which will be plotted with the solution results if turned on. This tool can be especially useful when running GSSHA in batch mode. View a plot of the simulations in order to determine which of the runs produce results similar to the observed data.
- Cell, Link, Node – Displays the I, J, link number, and node number for the selected node.
The spreadsheet contents change depending on whether Datasets or Summary file is chosen. The following columns are found in the spreadsheet:
- Display – Turn on a row to display the solution data in in the plots on the tabs below.
- Name – Displays the name of the dataset.
- Type – Displays the type of the dataset.
- Event – Displays the event connected to the dataset.
The Filters row allows the displayed data to be limited based on the selected criteria
- Display – Turn on to select all datasets. Turn off to deselect all datasets.
- Name – Select an option from the drop-down to show only those datasets that match the selected name.
- Type – Select from the following filter options:
- "Other"
- "Overland Flow Hydrograph"
- "Overland Depth"
- "Infiltration Depth"
- "Surface Moisture"
- "Rainfall"
- "Channel Depth"
- "Channel Flow"
- "Channel TSS Concentration"
- "Grid TSS Concentration"
- "Max Sediment Flux"
- "Net Volume of Sediment"
- "Groundwater Head"
- "Cumulative Groundwater Recharge"
- "Incremental Groundwater Recharge"
- "Outlet Hydrograph"
- "Precipitation"
- "Flow Direction"
- "Sediment Flux"
- "Net Sediment Transfer"
- "Contaminant Flux"
- "Flood Grid"
- "Flood Stream"
- "Snow Water Equivalent"
- "Nutrient Overland"
- "Contaminant Overland"
- Event – Filter using a drop-down of all applicable events.
There are three tabs in the plot section when Datasets is selected at the top of the dialog. The Compare tab allows datasets to be compared against each other. The Residual tab allows residual subsets to be plotted.
When Summary file is selected at the top of the dialog, there is a single Summary tab that displays a summary of the selected datasets over time.
At the bottom of the dialog are the following buttons:
- Help – Opens this article in a web browser.
- OK – Saves any changes and closes the GSSHA Solution Analysis dialog.
- Cancel – Discards any changes and closes the GSSHA Solution Analysis dialog.
| [hide] GSSHA | |
|---|---|
| XMS Wiki Links | Calibration (Automated • Manual • Output) • Channel Routing • Contaminants • Digital Dams • Embankment Arcs • Feature Objects (Arcs • Nodes • Polygons) • File Types • Groundwater • Groups • Hydraulic Structures • Job Control • Join SSURGO Data • Mapping Tables • Maps • Menu • Model Linkage • Multiple Simulations • Nutrients • Observations • Output Control • Overland Soil Erosion • Pipe and Node Parameters • Precipitation • Radar Rainfall • Save GSSHA Project File • Smooth GSSHA Streams • Snowmelt • Solution (Analysis • Data) |
| Related Tools | MWBM Wizard • Using Soil Type Data with GSSHA |
| GSSHA Wiki External Links | GSSHA Wiki: Overview • Primer • User's Manual • Tutorials |
| [hide] WMS – Watershed Modeling System | ||
|---|---|---|
| Modules: | Terrain Data • Drainage • Map • Hydrologic Modeling • River • GIS • 2D Grid • 2D Scatter |  |
| Models: | CE-QUAL-W2 • GSSHA • HEC-1 • HEC-HMS • HEC-RAS • HSPF • MODRAT • NSS • OC Hydrograph • OC Rational • Rational • River Tools • Storm Drain • SMPDBK • SWMM • TR-20 • TR-55 | |
| Toolbars: | Modules • Macros • Units • Digitize • Static Tools • Dynamic Tools • Drawing • Get Data Tools | |
| Aquaveo | ||